Download
1 / 50
500 likes | 507 Views
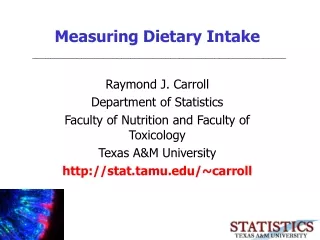
Measuring Dietary Intake. _________________________________________________________. Raymond J. Carroll Department of Statistics Faculty of Nutrition and Faculty of Toxicology Texas A&M University http://stat.tamu.edu/~carroll. I Still Cook.

E N D
Measuring Dietary Intake _________________________________________________________ Raymond J. Carroll Department of Statistics Faculty of Nutrition and Faculty of Toxicology Texas A&M University http://stat.tamu.edu/~carroll
I Still Cook _________________________________________________________ Me in the kitchen, Yokohama (my birthplace), 1953
Is this not cool? I took Hotelling’s position at UNC, then Fan took mine My photo was taken at the Wichita Mountains, December 1999 (by me)
Palo Duro Canyon, the Grand Canyon of Texas West Texas East Texas Wichita Falls, Wichita Falls, that’s my hometown Guadalupe Mountains National Park College Station, home of Texas A&M University I-45 Big Bend National Park I-35
What I am Not _________________________________________________________ I know that potato chips are not a basic healthy food group. However, if you ask me a detailed question about nutrition, then I will ask Joanne Lupton Nancy Turner Meeyoung Hong
You are what you eat,but do you know who you are? _________________________________________________________ • This talk is concerned with a simple question. • Will lowering her intake of fat decrease a woman’s chance of developing breast cancer?
Basic Outline _________________________________________________________ • Diet affects health. Many (not all!) studies though are not statistically significant. • Focus: quality of the instruments used to measure diet • Conclusion #1: The usual instruments are largely to blame. • Conclusion #2: Expect studies to disagree
Evidence in Favor of the Fat-Breast Cancer Hypothesis _________________________________________________________ • Animal studies • Ecological comparisons • Case-control studies
International Comparisons _____________________________________________________________
Evidence against the Fat-Breast Cancer Hypothesis _________________________________________________________ • Prospective studies • These studies try to assess a woman’s diet, then follow her health progress to see if she develops breast cancer • The diets of those who developed breast cancer are compared to those who do not • Prior to 2007, only 1 prospective study has found evidence suggesting a fat and breast cancer link, and 1 has a negative link
Prospective Studies _________________________________________________________ • NHANES (National Health and Nutrition Examination Survey): n = 3,145 women aged 25-50 • Nurses Health Study: n = 60,000+ • Pooled Project: n = 300,000+ • Norfolk (UK) study: n = 15,000+
The Nurses Health Study, Fat and Breast Cancer _________________________________________________________ 60,000 women, followed for 10 years Prospective study Note that the breast cancer cases were announcing that they eat less fat Donna Spiegelman, the NHS statistician
Clinical Trials _________________________________________________________ • The lack of consistent (even positive) findings led to the Women’s Health Initiative • Approximately 40,000 women randomized to two groups: healthy eating and typical eating
WHI Diet Study Objectives _________________________________________________________
Prior Objections to WHI _________________________________________________________ • Cost ($415,000,000) • Whether North Americans can really lower % Calories from Fat to 20%, from the current 38% • Even if the study was successful, difficulties in measuring diet mean that we will not know what components led to the decrease in risk.
Change in Fat Calories Over Time _________________________________________________________ Result from WHI Diet Clinical Trial Women reported a decrease in fat-calories, but not to 20%
How do we measure diet in humans? _________________________________________________________ • 24 hour recalls • Diaries • Food Frequency Questionnaires (FFQ) Walt Willett has a popular book and a popular FFQ
Food diaries _________________________________________________________ • Hot topic at NCI • Only measures a few day’s diet, not typical diet • A single 3-day diary finding a diet-cancer link is not universally scientifically acceptable • Need for repeated applications • Induces behavioral change??
Typical (Median) Values of Reported Caloric Intake Over 6 Diary Days: WISH Study
The Food Frequency Questionnaire _________________________________________________________
The Pizza Question _________________________________________________________
The Norfolk Study with ~Diaries and FFQ _________________________________________________________ 15,000 women, aged 45-74, followed for 8 years 163 breast cancer cases Diary: p = 0.005 FFQ: p = 0.229
Summary _________________________________________________________ • FFQ does not find a fat and breast cancer link • 24 hour recalls and diaries are expensive • They have found links, but in opposite directions • Diaries may modify behavior • Question: do any of these things actually measure dietary intake? • How well or how badly? • These are statistical questions!
Do We Know Who We Are? _________________________________________________________ • Karl Pearson was arguably the 1st great modern statistician • Pearson chi-squared test • Pearson correlation coefficient Karl Pearson at age 30
Do We Know Who We Are? _________________________________________________________ • Pearson was deeply interested in self-reporting errors • In 1896, Pearson ran the following experiment. • For each of 3 people, he set up 500 lines of a set of paper, and had them bisected by hand A gaggle of lines
Pearson’s Experiment _________________________________________________________ • He then had an postdoc measure the error made by each person on each line, and averaged • “Dr. Lee spent several months in the summer of 1896 in the reduction of the observations ” A gaggle of lines, with my bisections
Pearson’s Personal Equations _________________________________________________________ • Pearson computed the mean error committed by each individual: the “personal equations “ • He found: the errors were individual. His errors were to the right, Dr. Lee’s to the left Karl Pearson in later life
What Do Personal Equations Mean? _________________________________________________________ Laurence Freedman of NCI, with whom I did the work • Given the same set of data, when we are asked to report something, we all make errors, and our errors are personal • In the context of reporting diet, we call this “person-specific bias “
Model Details for Statisticians _________________________________________________________ • The model in symbols • The existence of person-specific bias means that variance of true intake is less than one would have thought
Model Details for Statisticians _________________________________________________________ • We fit a linear mixed model • The OPEN Study had the following measurements • Two FFQ • Two Protein biomarkers • Two Energy biomarkers
Our Hypothesis _________________________________________________________ • We hypothesized that when measuring Fat intake • The personal equation, or person-specific bias, unique to each individual, is large and debilitating. • The problem: the actual variability in American diets is much smaller than suspected.
Can We Test Our Hypothesis? _________________________________________________________ • We need biomarker data that are not much subject to the personal equation • There is no biomarker for Fat • There are biomarkers for energy (calories) and Protein • We expect that studies are too small by orders of magnitude
Biomarker Data _________________________________________________________ Victor Kipnis was the driving force behind OPEN • Calories and Protein: • Available from NCI’s OPEN study • Results are surprising
Sample Size Inflation _________________________________________________________ • There are formulae for how large a study needs to be to detect a true doubling of risk from low and high Fat/Energy Diets • These formulae try to account for measurement error • These formulae ignore the personal equation • We recalculated the formulae
Biomarker Data: Sample Size Inflation _________________________________________________________ If you are interested in the effect of calories on health, multiply the sample size you thought you needed by 11. For protein, by 4.5
Relative Risk _________________________________________________________ If high calories increases the risk of breast cancer by 100% in fact, and you change your intake dramatically, the FFQ thinks doing so increases the risk by 4% Result: It is not possible to tell if changing your absolute caloric intake, or your fat intake, or your protein intake will have any health effects
Relative Risk, Food Composition _________________________________________________________ If high protein (fat) increases the risk of breast cancer by 100%, your calories remain the same, you dramatically lower your protein (fat) intake, then FFQ thinks your risk increases by 20%-30% Result: It is pretty difficult to tell if changing your food composition while maintaining your caloric intake will have any health effects
New Results _________________________________________________________ • The AARP Study: 250,000+ women, by far the greatest number in any single study • Results: • Huge size statistical significance • FFQ small measured increase in risk for dramatic behavioral change (1.32 after correction) • Statistician’s dream: use Pearson’s idea to get at the true increase in risk A happy statistician dreaming about AARP
New Results _________________________________________________________ • The WHI Controls Study: 30,000+ women • All with > 32% Calories from Fat via FFQ • Diaries in a nested case-control study • Highly significant fat effect in the diaries (ObservedRR in quantiles = 1.6) A happy statistician doing field biology in the Kimberley
Summary _________________________________________________________ • WHI, 2006, clinical trial • My best case conjecture in 2005: • Probably no statistically significant effects • The p-value was 0.07, relative risk about 1.2 • My best case conjecture in 2008 after further follow-up • Statistically significant, modest effects
You are what you eat,but do you know who you are? _________________________________________________________ • Diet is incredibly hard to measure • Even 100% increases in risk cannot be seen in large cohort studies with an FFQ • If you read about a diet intervention, measured by a FFQ, and it achieves statistical significance multiple times: wow!
You are what you eat,but do you know who you are? _________________________________________________________ • Much work at NCI and WHI and EPIC on new ways of measuring diet • EPIC (a multi-country study) may be a model, because of the wide distribution of intakes
What Was Done _________________________________________________________ • The OPEN analysis actually fit Protein and Energy together. • We call this the Seemingly Unrelated Measurement Error Model • Can get major gains in efficiency
SUMEM _________________________________________________________ • Gains in efficiency come from the correlations of the random effects
Model Details for Statisticians _________________________________________________________ • The model in symbols • Linear mixed model, fit by PROC MIXED
Attenuation _________________________________________________________ • The attenuation is the slope in the linear regression of X on Q
Relative Risk and Attenuation _________________________________________________________ • Start with a logistic model • True relative risk • Observed relative risk (regression calibration)
Relative Risk and Attenuation _________________________________________________________