Download
1 / 22
250 likes | 346 Views
Physical changes. Brainstorm states of matter:. TEMPERATURE. The measure of the average energy of motion of the particles in a substance is. Changes in state are physical changes. Image source: http://itl.chem.ufl.edu/2041_u99/lectures/lec_f.html. PHYSICAL CHANGE.

E N D
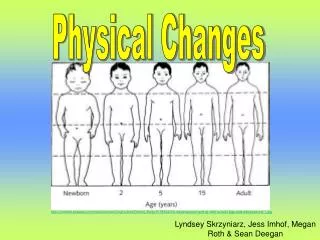
Physical changes Brainstorm states of matter:
TEMPERATURE The measure of the average energy of motion of the particles in a substance is
Changes in state are physical changes Image source: http://itl.chem.ufl.edu/2041_u99/lectures/lec_f.html
PHYSICAL CHANGE A change that alters the form or appearance of a material but does not convert the material into new substances.
Graph showing changes in temperature over time: • Key Questions: • How does the graph show the transformation of water? • Describe the transformations that took place. • Describe what was happening at the particle level. • Make improvements in your graph. Show the following: • Diagram of particles at different • stages/phases. • Label processes such as melting, • condensing, boiling, evaporating • (Refer to your photos) • c. Graph of volume of water over time Organize your photos to create a short video-journal of the transformation of Water.
Time-Temperature Graph for Water 100 Temperature (degrees Celsius) 0 Time (minutes)
Time- Temperature Graph for Water When will the temperature of the water rise above 100 degrees Celsius? 100 Temperature (degrees Celsius) Why is the slope of the graph flat (no temperature change) at 100 degrees even though the stove is still on? Why did temperature increase at a constant rate? What is true for the ice-water mixture when the temperature began to rise? 0 Time (minutes) Why is the slope of the graph flat (no temperature change) at 0 degrees?
Temperature –Time Graph for heating water Why is the slope of the graph flat (no temperature change) at 0 degrees and 100 degrees even though the stove is still on? What is true for the ice-water mixture when the temperature began to rise? Why did temperature increase at a constant rate? When will the temperature of the water rise above 100 degrees Celsius?
Temperature –Time Graph for heating water Why is the slope of the graph flat (no temperature change) at 0 degrees and 100 degrees even though the stove is still on? What is true for the ice-water mixture when the temperature began to rise? Why did temperature increase at a constant rate? When will the temperature of the water rise above 100 degrees Celsius? energy from stove = energy required for phase change. No temperature change No ice remains- only water for temp to increase Constant stove temp, constant amount of water When only water vapor remains- one state of matter
Time- Temperature Graph for Water Once the water is in the gas phase, additional heat input raises the temperature of the water vapor Note: greater energy is needed to vaporize water than to melt it. WHY? 100 As the liquid begins to boil. Additional input of heat energy does not raise the temperature of the water, rather it is used to break water bonds. i.e. phase change. Temperature (degrees Celsius) • As the temp approaches boiling point, the KE of the molecules is sufficient to allow the separation of molecules into the gas phase. Once the water is in a liquid phase, increasing the amount of heat input raises the temp of the liquid water. As the ice begins to melt, additional heat energy does not raise the temperature of the water, but loosens the bonds changing ice to water. i.e. phase change – melting. 0 Time (minutes) • As the temp approaches melting point temperature, the KE of the water molecules increases loosening the bonds between water molecules.
Page 49 Copy Red and Blue-colored text Phase Change- Vaporization energy from stove = energy required for phase change No temperature change Two states of Matter One state of Matter Energy from stove causes increased KE and increased Temperature Phase Change- Melting energy from stove = energy required for phase change No temperature change Two states of Matter Energy from stove causes increased KE and increased Temperature
http://www.media.pearson.com.au/schools/cw/au_sch_whalley_sf1_1/int/2_slg.htmlhttp://www.media.pearson.com.au/schools/cw/au_sch_whalley_sf1_1/int/2_slg.html Animation- particles and sublimation
Matter changes whenever energy is added or taken away. Energy is added: Solid Liquid Gas Energy is removed: Gas Liquid Solid
Image source: http://cse.ssl.berkeley.edu/artemis/mission_sunearth_closeup1.html