Download

1 / 37
380 likes | 629 Views
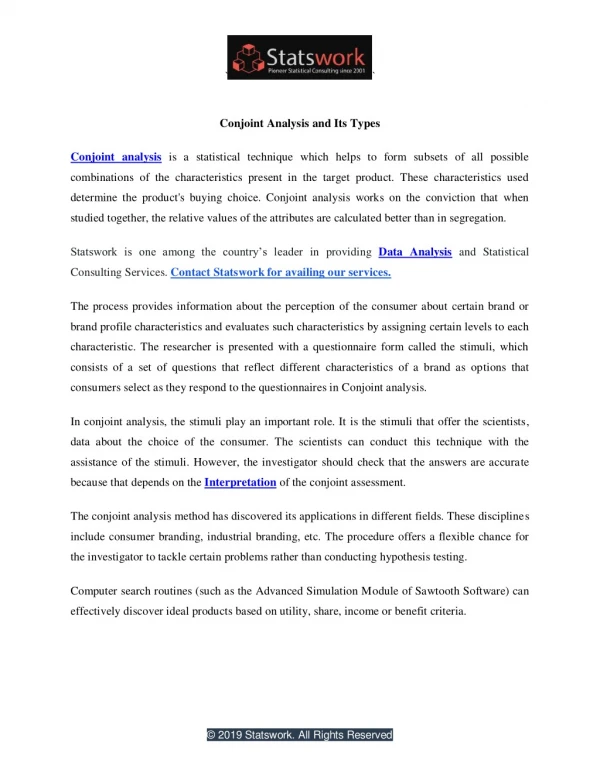
Applied Conjoint Analysis. Applied Conjoint Analysis. Conjoint, or trade-off, analysis can be a powerful tool for the marketer, typically used when the research question concerns product or service development issues or pricing strategies.

E N D
Applied Conjoint Analysis Conjoint, or trade-off, analysis can be a powerful tool for the marketer, typically used when the research question concerns product or service development issues or pricing strategies. By asking respondents to “trade-off” one product feature to obtain another, conjoint unearths the importance of product features to consumers’ purchase decisions, and calculates the particular combination of price and specific product features which maximize a product’s appeal to consumers.
A Note on the Effectiveness of Conjoint Analysis “Traditional conjoint analysis makes some heroic assumptions, including the proposition that the value of a product is equal to the sum of the value of its parts (i.e., simple additivity), and that complex decision-making can be explained using a limited number of dimensions. Despite the leaps of faith, conjoint analysis tends to work well in practice, and gives managers, engineers and marketers great insight to reduce uncertainty when facing important decisions. Conjoint analysis isn’t perfect, but we don’t need it to be. With all its assumptions and imperfections, it still trumps other methods.” Source: Quirk’s, July / August 2004
Conjoint Overview • Factors or Features • Levels within Factors • Key Outputs: • Relative importance of factors • Preference for levels of a given factor • Utility structures • Key Analysis: • -Simulation models • -current product mix • -new product development • -segmentation • -Price elasticity
Product Factors • Kitchen Faucets: • Type of handles • Type of spout • Finish • Sprayer • Washer type • Warranty • Brand • Price
Levels of Product Factors • Kitchen Faucets: • Type of handles • 2 handled metal • 2 handled acrylic • 1 handled ball • Etc.
How do I know what factors and levels to use? • Typically, qualitative analysis is done first (focus groups, for instance) • Look to your client (as a vendor) • If YOU ARE the client, look to internal decision makers, product managers, secondary data – do your homework! Without the right factors and levels, a conjoint study is worthless!
The Process Once you’ve selected factors and levels, be sure to provide the appropriate stimuli to respondents prior to the conjoint task. For example, if finish is a factor, show REAL versions, not just images or descriptions.
FACTOR IMPORTANCE The importance of each “product factor” to the consumer’s product selection. For example, how much impact does finish type have compared to price or brand? The following is an example from the kitchen faucet discussed earlier. As can be seen, the type of spout has much more impact than either handle type or brand. RELATIVE IMPORTANCE OF TRADE-OFF FACTORS -KITCHEN FAUCET- 39% Spout Type 19% Handle Type 17% Brand 15% Finish 5% Price 5% Valve 0% 10% 20% 30% 40% 50%
UTILITY STRUCTURE “Utility” is a numerical expression of the value consumers place on an factor level. UTILITY: HANDLE TYPE 2 Handle-Metal Levers 2 Handle – Porcelain Levers 1 Handle – Decorative Metal Lever 2 Handle – Acrylic Knobs 1 Handle – Porcelain Lever A “higher” utility means it has more value, a “low” utility means it has less value. 1 Handle – ½ Ball Lever 2 Handle – Porcelain Cross Levers 1 Handle – Acrylic Knob
LEVEL PREFERENCE The value of each “level” of a factor to consumers (e.g., the different finishes tested). The sample graphic shows the percent preferring each level of the ‘handle’ factor for the kitchen faucet example.
UTILITY STRUCTURE Composition Rule: Additive Factor1, Level1+Factor2,Level3+Factor3,Level2=Overall Utility
SIMULATION Kitchen Faucet Simulation: Single Handles Faucets, Faucets, Faucets 1 H – Flat D Tube Spout Spray 400/8500 No Filter Chrome $58.09 (highest) Ceramic Disc Faucets, Faucets, Faucets Faucets ‘R Us 1H – Ball D Tube Spout No Spray No Filter Chrome $63.06 (highest) Stainless Steel Ball 27% Faucets ‘R Us 26% Cheapstuff 1H – Flat Curved Spout Spray 400/8500 No Filter Chrome $59.63 (highest) Stainless Steel Ball Cheapstuff 17% Brand X 1H – Flat D Tube Spout Spray 400/8500 No Filter Chrome $61.92 (highest) Plastic Cartridge Brand X 16% Brand Z 1H – Flat Curve Spout Spray 400/8500 No Filter Chrome $58.09 (highest) Ceramic Disc Brand Z 14% 0% 10% 20% 30% 40% 50%
CONJOINT METHODS Three main categories -Traditional -ACA (Adaptive Conjoint) -CBC (Choice Based Conjoint)
Traditional Conjoint Uses an “orthogonal array” for product combinations. The trade-off task is typically a card sort – for example, 16 cards depicting the array were given to respondents and sorted from most desirable to least desirable. Ratings can be used as well. The analysis takes the rank order (or ratings) of the stimuli and uses it to calculate individual utilities that can then be extrapolated to all possible combinations. -Price elasticity is suspect. -Limited number of factors and levels. -Main effects model.
TRADITIONAL CONJOINT EXAMPLE -Stimuli needed -Respondent task -Data analysis
ACA Adaptive Conjoint Analysis is a hybrid conjoint approach in that it uses both analysis of product combinations (combinations of factor levels) as well as self-reported importance information to derive utilities. Three components of analysis: -Factor ratings (preferability) -Rank order of levels within factors -Graded comparisons of partial product combinations -It allows for a larger number of factors and levels can be analyzed. -Can only be administered via computer. -Cannot analyze interactions. -Price elasticity still an issue.
CBC CBC, or Choice Based Conjoint, has become the preferred method, due to it’s ability to truly gauge price elasticity, and it’s easy to comprehend trade-off task. Full product combinations are pitted against each other in “choice sets”. Respondents choose among the products depicted, or (as an option) can choose none of the products. A respondent typically receives anywhere from 10 to 20 choice sets, depending on the number of factors and levels in the design. -It’s modeling capabilities (interactions, special effects, etc.) are seen as an improvement from prior methods. -Due to relative pricing, elasticity models are more accurate. -Like ACA, allows for more factors and levels than traditional method. -Individual utilities now available (first versions generated aggregate models)
CBC EXAMPLE -Stimuli needed -Respondent task -Data analysis
Max/Diff Analysis MaxDiff is an approach for obtaining preference/importance scores for multiple items (brand preferences, brand images, product features, advertising claims, etc.). Although MaxDiff shares much in common with conjoint analysis, it is easier to use and applicable to a wider variety of research situations. MaxDiff is also known as “best-worst scaling.” * MaxDiff (or Best/Worst) is primarily used to gain a hierarchy of a set of items – such as importance ratings, value propositions, menu choices, etc. Like ‘conjoint’ or ‘discrete choice’ methods, the result is a ‘derived’ measure of strength or impact. Why use MaxDiff instead of standard rating scales? Research has shown that MaxDiff scores demonstrate greater discrimination among items and between respondents on the items. The MaxDiff question is simple to understand, so respondents from children to adults with a variety of educational and cultural backgrounds can provide reliable data. Since respondents make choices rather than expressing strength of preference using some numeric scale, there is no opportunity for scale use bias. This is an extremely valuable property for cross-cultural research studies. * *Source: Sawtooth Software
Voice: 330-670-1117 Fax: 330-670-1118 Email: rantilla@actionbased.com Web: www.actionbased.com


![Preference Elicitation [Conjoint Analysis]](https://cdn2.slideserve.com/5322185/preference-elicitation-conjoint-analysis-dt.jpg)