Download
1 / 11
110 likes | 115 Views
In this article, we are going to learn a very interesting concept which is how to create insights in Power BI desktop application of your Facebook data. Power BI provides a connector to link Power BI desktop to your facebook account. <br><br>https://www.loginworks.com/blogs/how-to-create-facebook-analytics-with-power-bi-desktop/

E N D
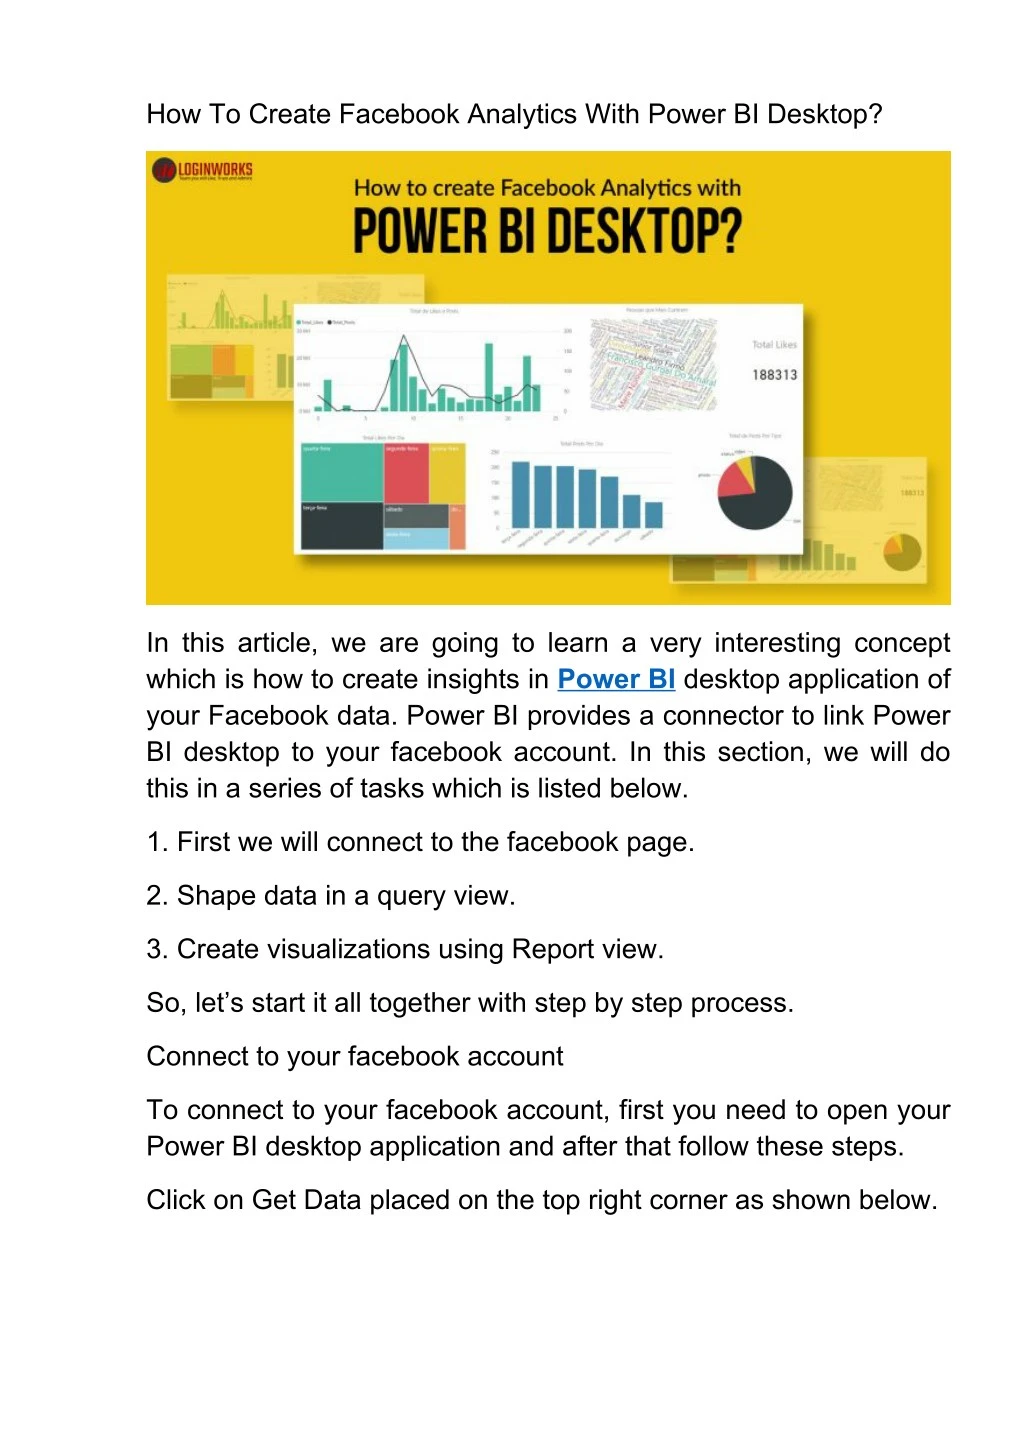
How To Create Facebook Analytics With Power BI Desktop? In this article, we are going to learn a very interesting concept which is how to create insights in Power BI desktop application of your Facebook data. Power BI provides a connector to link Power BI desktop to your facebook account. In this section, we will do this in a series of tasks which is listed below. 1. First we will connect to the facebook page. 2. Shape data in a query view. 3. Create visualizations using Report view. So, let’s start it all together with step by step process. Connect to your facebook account To connect to your facebook account, first you need to open your Power BI desktop application and after that follow these steps. Click on Get Data placed on the top right corner as shown below.
2. Click on ‘More’ to open all the options. 3. Search for Facebook in the input box and click Connect. It will open up a dialog box.
4. Within the dialog box you need to enter the username of your account and in the connection part, you need to select what information you need to extract from your account like posts, comments, Feed, friends, books, games. etc. and click OK which will redirect you to the facebook access dialog box. 5. In the dialog box, you need to click on Sign In and it will open the facebook login page where you need to enter your Facebook credentials and click Login. The below image is showing the same.
6. After Sign In you need to click Connect. It will show all your data. Our first step is completed as we have imported the Facebook data into our Power BI Experts desktop application. Before creating any visualizations, first we need to edit the data which will be our next step. I have connected to Power BI with my Facebook Like data. The data look like this.
Before Load click on Edit to open Power Query Editor. Shape data in a query view When you click on Edit, it will redirect you to the Power Query Editor which looks like this. Within the query editor, you need to do some cleaning the data like changing the column name or removing the column name. First, let’s rename the column name from Name to Pages you liked. The name should be meaningful so that we can understand what is the data inside the column. Rename the column name To rename the column, right click on the column name and it will open a set of options. You need to choose rename and enter the column name you want.
You can see the result below as column name changed. If you look closely created time column datatype is text but this column is showing the time when you liked the page. So, the data type for this should be date/time. We can easily change this. How to change the data type of a column? Mostly all types of data types are present in Query Editor like- 1. Decimal Number 2. Whole Number 3. Percentage 4. Data/TIme 5. Text
6. Binary We must change the type according to values inside the column. It is a necessary step. Suppose you want to create a Line chart with respect to time as a dimension and within the column, you declare the datatype of the column as text. It will not create a time graph as it is not able to understand the value within the column is Date, not the text. In the same way, we need to do this for our data too. To change the column name simply right click on the column name and select Changed Type and then choose Date Timezone and it will change the column type. If you look closely on the right-hand side of your page, some steps are added in the Query Settings box. We have implemented all these steps above. If you want to undo any step, just simply click on the crossmark of the step.
Create visualizations based on Data So far, we exported the data from facebook account and imported the data into our Power BI desktop. Our next step is to create visualizations inside the canvas area. We can create two visualizations based on our data. Our data has fewer columns so cannot create impressive visuals. The visuals are: 1. Count of pages you liked for every year. 2. Count of id for every year. For the first visualization, we will choose line graph which you need to select from the visualization pane of your Power BI desktop and in the axis section you need to drag created time
column and in the values, you need to drag Pages you liked the column. This will create a graph which looks like this. For the second visualization, we are going to choose the clustered column chart and follow the same procedure. In the axis section, you need to drag the created time column and in the value, you need to drag the id and need to find count. The graph looks like this. Conclusion In this article, we learned how to import data of your Facebook account into Power BI desktop and also how to edit the data in power query editor and final step how to create reports based on data. The data which I imported in this application is a bit short. You can import daFacebookur facebook posts which will create
good insights. If you have any query regarding the concepts, you can write below in the comment section. Thanks! Connect With Source Url:- https://www.loginworks.com/blogs/how-to-create-facebook- analytics-with-power-bi-desktop/