Download
1 / 1
10 likes | 109 Views
Java Climate Model,. Connecting Science & Policy, from Emissions to Impacts. Try it yourself, on the Web: climatechange.unep.net/jcm/ www.chooseclimate.org/jcm/ www.climate.unibe.ch/~matthews/jcm/. Dr Ben Matthews ben@chooselimate.org Currently at: Klima & UmweltPhysik, Univ Bern

E N D
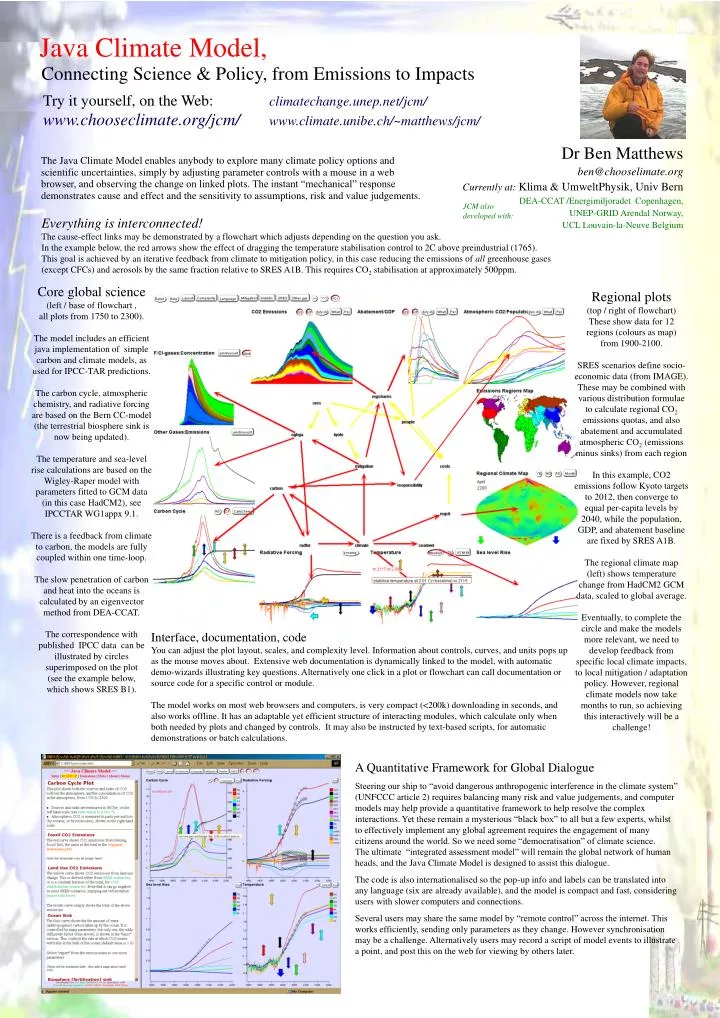
Java Climate Model, Connecting Science & Policy, from Emissions to Impacts Try it yourself, on the Web:climatechange.unep.net/jcm/www.chooseclimate.org/jcm/ www.climate.unibe.ch/~matthews/jcm/ Dr Ben Matthews ben@chooselimate.org Currently at: Klima & UmweltPhysik, Univ Bern DEA-CCAT /Energimiljoradet Copenhagen, UNEP-GRID Arendal Norway, UCL Louvain-la-Neuve Belgium The Java Climate Model enables anybody to explore many climate policy options and scientific uncertainties, simply by adjusting parameter controls with a mouse in a web browser, and observing the change on linked plots. The instant “mechanical” response demonstrates cause and effect and the sensitivity to assumptions, risk and value judgements. JCM also developed with: Everything is interconnected! The cause-effect links may be demonstrated by a flowchart which adjusts depending on the question you ask. In the example below, the red arrows show the effect of dragging the temperature stabilisation control to 2C above preindustrial (1765). This goal is achieved by an iterative feedback from climate to mitigation policy, in this case reducing the emissions of all greenhouse gases (except CFCs) and aerosols by the same fraction relative to SRES A1B. This requires CO2 stabilisation at approximately 500ppm. Core global science (left / base of flowchart , all plots from 1750 to 2300). The model includes an efficient java implementation of simple carbon and climate models, as used for IPCC-TAR predictions. The carbon cycle, atmospheric chemistry, and radiative forcing are based on the Bern CC-model (the terrestrial biosphere sink is now being updated). The temperature and sea-level rise calculations are based on the Wigley-Raper model with parameters fitted to GCM data (in this case HadCM2), see IPCCTAR WG1appx 9.1. There is a feedback from climate to carbon, the models are fully coupled within one time-loop. The slow penetration of carbon and heat into the oceans is calculated by an eigenvector method from DEA-CCAT. The correspondence with published IPCC data can be illustrated by circles superimposed on the plot (see the example below, which shows SRES B1). Regional plots (top / right of flowchart) These show data for 12 regions (colours as map) from 1900-2100. SRES scenarios define socio-economic data (from IMAGE). These may be combined with various distribution formulae to calculate regional CO2 emissions quotas, and also abatement and accumulated atmospheric CO2 (emissions minus sinks) from each region In this example, CO2 emissions follow Kyoto targets to 2012, then converge to equal per-capita levels by 2040, while the population, GDP, and abatement baseline are fixed by SRES A1B. The regional climate map (left) shows temperature change from HadCM2 GCM data, scaled to global average. Eventually, to complete the circle and make the models more relevant, we need to develop feedback from specific local climate impacts, to local mitigation / adaptation policy. However, regional climate models now take months to run, so achieving this interactively will be a challenge! Interface, documentation, code You can adjust the plot layout, scales, and complexity level. Information about controls, curves, and units pops up as the mouse moves about. Extensive web documentation is dynamically linked to the model, with automatic demo-wizards illustrating key questions. Alternatively one click in a plot or flowchart can call documentation or source code for a specific control or module. The model works on most web browsers and computers, is very compact (<200k) downloading in seconds, and also works offline. It has an adaptable yet efficient structure of interacting modules, which calculate only when both needed by plots and changed by controls. It may also be instructed by text-based scripts, for automatic demonstrations or batch calculations. A Quantitative Framework for Global Dialogue Steering our ship to “avoid dangerous anthropogenic interference in the climate system” (UNFCCC article 2) requires balancing many risk and value judgements, and computer models may help provide a quantitative framework to help resolve the complex interactions. Yet these remain a mysterious “black box” to all but a few experts, whilst to effectively implement any global agreement requires the engagement of many citizens around the world. So we need some “democratisation” of climate science. The ultimate “integrated assessment model” will remain the global network of human heads, and the Java Climate Model is designed to assist this dialogue. The code is also internationalised so the pop-up info and labels can be translated into any language (six are already available), and the model is compact and fast, considering users with slower computers and connections. Several users may share the same model by “remote control” across the internet. This works efficiently, sending only parameters as they change. However synchronisation may be a challenge. Alternatively users may record a script of model events to illustrate a point, and post this on the web for viewing by others later.