Download
1 / 17
170 likes | 281 Views
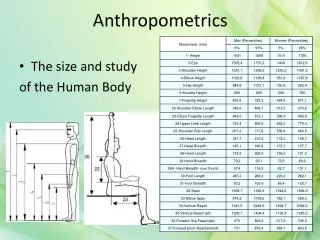
Anthropometrics in Obesity. Robert Kushner, MD Northwestern University Feinberg School of Medicine. Anthropometrics in Obesity. Height Weight Body Mass Index (BMI) [weight/height] 2 Kg/m 2 (lb/in) 2 x 703 Distribution of body fat Waist-hip ratio (WHR) Waist circumference

E N D
Anthropometrics in Obesity Robert Kushner, MD Northwestern University Feinberg School of Medicine
Anthropometrics in Obesity • Height • Weight • Body Mass Index (BMI) [weight/height]2 • Kg/m2 • (lb/in)2 x 703 • Distribution of body fat • Waist-hip ratio (WHR) • Waist circumference • Body composition • Percent body fat
Anthropometrics in Obesity • Height • Weight • Body Mass Index (BMI) [weight/height]2 • Kg/m2 • (lb/in)2 x 703 • Distribution of body fat • Waist-hip ratio (WHR) • Waist circumference • Body composition • Percent body fat
340 200 130 160 210 140 150 170 190 220 230 250 260 270 280 290 320 360 120 180 240 300 380 400 23 22 21 19 18 17 16 15 15 25 24 22 21 20 19 18 17 16 27 26 24 23 21 20 19 18 17 29 27 26 24 23 22 20 19 18 31 29 28 26 24 23 22 21 20 33 31 29 27 26 24 23 22 21 35 33 31 29 27 26 24 23 22 37 35 33 31 29 27 26 24 23 39 37 34 32 30 29 27 26 24 41 38 36 34 32 30 29 27 26 43 40 38 36 34 32 30 28 27 45 42 40 37 35 33 31 30 28 47 44 41 39 37 35 33 31 29 49 46 43 40 38 36 34 32 30 51 48 45 42 40 37 35 33 32 53 49 46 44 41 39 37 35 33 55 51 48 45 43 40 38 36 34 57 53 50 47 44 42 39 37 35 59 55 52 49 46 43 41 39 37 63 59 55 52 48 46 43 41 40 66 62 58 55 52 49 46 44 41 70 66 62 58 55 52 49 46 44 74 70 65 61 58 55 52 49 46 78 73 69 65 61 57 54 51 49 Body Mass Index Chart Weight (lb) 60 62 64 66 Height (in) 68 70 72 74 76
BMI-Associated Disease Risk Classification BMI (kg/m2) Risk • Underweight <18.5 Increased • Normal 18.5–24.9 Normal • Overweight 25.0–29.9 Increased • Obese I 30.0–34.9 High • II 35.0–39.9 Very high • III 40 Extremely high • Additional risks: • Large waist circumference (men >40 in; women >35 in) • 5 kg or more weight gain since age 18–20 y • Poor aerobic fitness • Specific races and ethnic groups Clinical Guidelines on the Identification, Evaluation, and Treatment of Overweight and Obesity in Adults—The Evidence Report. Obes Res 1998;6(suppl 2).
Multivariate relative risk of death from cardiovascular disease, cancer, and all other causes among men and women who had never smoked and who had no history of disease at enrollment, according to body-mass index. The reference category was made up of subjects with a body-mass index of 23.5 to 24.9. <18.5 18.5-20.4 >35.0 23.5-24.9 25.0-26.4 26.5-27.9 28.0-29.9 30.0-31.9 32.0-34.9 20.5-21.9 22.0-23.4 Relative Risk of Death From Cardiovascular Disease, Cancer, and All Other Causes Men Women 2.4 2.2 2.0 1.8 1.6 1.4 1.2 1.0 0.8 0.6 3.2 3.0 2.8 2.6 2.4 2.2 2.0 1.8 1.6 1.4 1.2 1.0 0.8 0.6 Cardiovascular disease Cancer All other causes Relative Risk of Death Relative Risk of Death <18.5 18.5-20.4 >40.0 30.0-31.9 32.0-34.9 35.0-39.9 26.5-27.9 28.0-29.9 23.5-24.9 25.0-26.4 20.5-21.9 22.0-23.4 Body-Mass Index Body-Mass Index Calle EE, et al. N Engl J Med. 1999;341:1097-1105.
93.2 Men Women 54.0 42.1 40.3 27.6 21.3 15.8 8.1 11.6 5.0 6.7 4.3 2.9 2.2 4.4 1.5 1.0 1.0 1.0 Relationship Between BMI and Risk of Type 2 Diabetes Mellitus 100 75 Age-Adjusted Relative Risk 50 25 0 23–23.9 <22 <23 24–24.9 25–26.9 27–28.9 29–30.9 31–32.9 33–34.9 35+ Body Mass Index (kg/m2) Chan J et al. Diabetes Care 1994;17:961. Colditz G et al. Ann Intern Med 1995;122:481.
Action BMI Ranges forAsian Populations are Lower High to very high risk WHO expert consultation. Lancet 2004;363:157
Relationship Between BMI and Percent Body Fat in Men and Women 70 • Age • Gender • Race Women 60 Men 50 40 Body Fat (%) 30 20 10 0 50 60 0 10 20 30 40 Body Mass Index (kg/m2) Adapted from: Gallagher et al. Am J Clin Nutr 2000;72:694.
Android Gynoid
Waist CircumferenceMeasurement Sites • Immediately below the lowest rib • At the narrowest waist1 • Midpoint between the lowest rib and the iliac crest2 • Immediately above the iliac crest3,4 • Anthropometric Standardization Reference Manual • World Health Organization (WHO) • National Institutes of Health (NIH) • National Health and Nutrition Examination Survey (NHANES)
How to Measure Waist Circumference • Place a measuring tape, held parallel to the floor, around the patient’s abdomen at a designated level. • The tape should fit snugly around the waist without compressing the skin • Take the measurement at the end of a normal expiration A waist circumference (at iliac crest) of ≥40 inches in men or ≥35 inches in women is diagnostic of abdominal obesity and suggests the presence of other cardiometabolic risk factors. Adapted from Grundy SM, et al. Circulation. 2005;112:2735-2752.
Classification of overweight and obesity by BMI, waist circumference and associated disease risks Disease Risk Relative to Normal Weight and Waist Circumference BMI (kg/m2) <18.5 18.5 - 24.9 25.0 - 29.9 30.0 - 34.9 35.0 - 39.9 >40 Obesity Class I II III Men (<102 cm) <40 in Women (<88 cm) <35 in -- -- Increased High Very High Extremely High Men (>102 cm) >40 in Women (>88 cm) >35 in -- -- High Very High Very High Extremely High Underweight Normal Overweight Obesity Extreme obesity Clinical Guidelines on the Identification, Evaluation, and Treatment of Overweight and Obesity in Adults—The Evidence Report. Obes Res 1998;6(suppl 2).
Metabolic Syndrome: Refined Criteria (IDF) Population Group Waist Circumference(inches) Men Women USA (NCEP ATP III) >40 >35 European >37 >30.5 South Asian/ >35.5 >30.5 Chinese Japanese >33.5 >35.5
Body Composition (body fat) • Skinfold Anthropometry • Bioelectrical impedance analysis (BIA) • Dual-energy x-ray absorptiometry (DEXA) • Computed tomography (CT scan) • Abdominal visceral fat
Assessing Canine Obesity Optimal Overweight Obese BCS=5 BCS= 6-7 BCS = 8-9