Download
1 / 20
200 likes | 203 Views
This article provides a comprehensive review of Analysis of Variance (ANOVA), including its definition, appropriate usage, assumptions, and interpretation. It also explores alternatives to conventional ANOVA when assumptions are violated, such as modifications/transformations of data and nonparametric tests. Additionally, the article covers contingency tables analysis using cross-tabulations and the Chi-Square test.

E N D
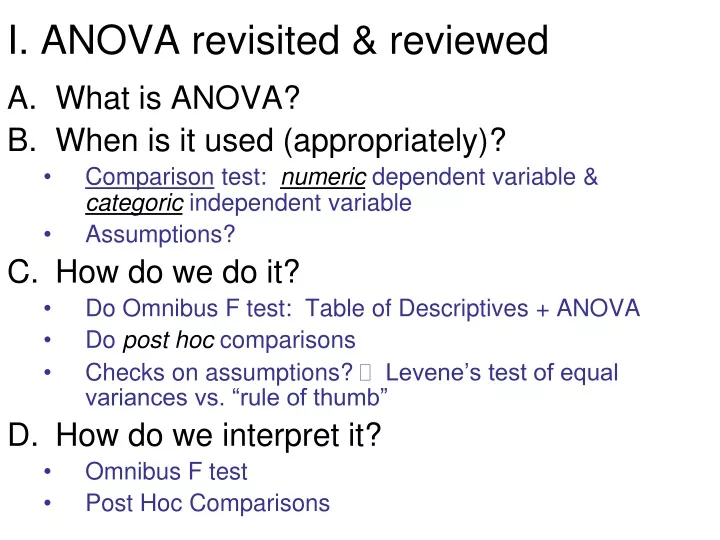
I. ANOVA revisited & reviewed What is ANOVA? When is it used (appropriately)? Comparison test: numeric dependent variable & categoric independent variable Assumptions? How do we do it? Do Omnibus F test: Table of Descriptives + ANOVA Do post hoc comparisons Checks on assumptions? Levene’s test of equal variances vs. “rule of thumb” How do we interpret it? Omnibus F test Post Hoc Comparisons
II. ANOVA alternatives: What if we violate assumptions for ANOVA? Alternatives to conventional ANOVA: Modifications/Transformations of data Nonparametric tests – when assumptions are seriously violated (e.g. ordinal dependent var.) rely on ordinal dependent variables & not assume normal (or parametric) distribution of data values Use only ordinal (rank order) information There are Nonparametric analogs for all the t-tests and F-tests used with numeric variables (e.g., the Median test described in the text) They are generally less “powerful” They are less often used
III. Contingency Tables for Analysis If both variables = categoric (nominal or ordinal-with-few-levels), then: Use Cross-tabulations (instead of means comparisons) (aka “Contingency tables”) Use Chi-Square statistical test (instead of z, t, or F tests) denoted by Greek symbol Χ2 Cross-tabs revisited (from 2nd week of class) What does a cross-tabulation show? When to use a cross-tabulation? How to set up a cross-tab? How to test for a “significant difference” or “significant contingency”?
III. Contingency Tables for Analysis Cross-tabs revisited What does a cross-tabulation show? Conditional distribution of one variable across categories or levels of another The unconditional (non-contingent) distribution is in the “margins” of the cross-tabulation these are thus called the “marginal frequencies” They represent the distribution of each variable while ignoring the other variable (treating them as independent)
III. Contingency Tables for Analysis Cross-tabs revisited When to use a cross-tabulation? When both variables are categorical (or discrete) And the number of categories or levels in each is fairly small (< 5) (< 10) How to set up a cross-tab? Rows versus Columns – which variable goes where? Percentaging the table – which way? Percentage in direction of Indep Variable
C. Chi-Square Test Statistical Test for Cross-Tabulations Chi-Square Test of Independence What does it mean or represent? Chi-square statistic with known probability distribution (& a single df parameter) Sum of squared-deviations-of-observed-from-expected fits a Chi-square distribution. Concerns deviations of observed values from values predicted under the Null H. Test to see if the observed pattern is likely by random sampling error (if Null H true)
C. Chi-Square Test Chi-Square test of Independence (cont.) How to do it? (by hand) (1) Compute expected frequencies (under independence) (2) Compute squared deviations of observed frequencies from expected frequencies (if using computing formula, square the original scores) (3) Compute Chi-square statistic & probability level (for the degrees of freedom of the table) (4) [Or use an web-base statistical calculator]
Simpler Computing Formula for Chi-Square: Original Formula: Computing Formula:
C. Chi-Square Test Chi-Square test of Independence (cont.) How to compute it in SPSS? Select Cross-tabs procedure from Analyze drop-down menu Select the variables for Rows and Columns of the table Use Cells options to select how to percentage the table Use Statistics options to select Chi-Squares statistic How to read the output? Use Pearson Chi Squarefor most cross-tabs (larger than 2x2) Use Continuity (Yates) Correction for small 2x2 tables(??) Use Fisher’s Exact Test for 2x2 tables (recommended) If statistically significant, visually compare the percentages in the cells (across values of the Independent variable) How to report the results? (1) Report the cross-tabulation (frequencies & percents) (2) Report the relevant Chi-square value and associated p-value
C. Chi-Square Test Chi-Square test of Independence (cont.) How to interpret it? As Test of “no association” or “no relation” between variables Strongly influenced by: Sample size Degrees of freedom (i.e., the size of table) Assumptions? Variables are independent Data are randomly sampled Moderately large number of cases Limitations? Not as valid for small tables with small numbers of cases Use Yate’s Correction for hand-calculated 2x2 tables (??) Use Fisher’s Exact test in SPSS for 2x2 tables (better) Less valid when expected cell sizes are < 5
C. Chi-Square Test Chi-Square “Goodness-of-fit” test = an often-used alternative procedure (with a reversed logic) Used when the Null-hypothesis is actually the hypothesis of interest (not a “statistical straw man”) Test to see if assuming the null is reasonable Goal is to affirm or accept the null hypothesis with a degree of statistical certainty Widely used but statistically “inchoate” Chances of a decision error when accepting the null-H are unknown and incalculable as it is generally used Uses ordinary null-hypothesis testing procedures but “turns the decision inside out” ( makes an unfounded decision) Decision is highly sensitive to sample size variations It is statistically sound only when Type 2 errors and “statistical power” are explicitly included in the decision