Download
1 / 26
280 likes | 440 Views
Livelihoods analysis, aquaculture and irrigation in India . Cecile Brugere, John Lingard. Department for International Development. Dept. of Agricultural Economics and Food Marketing University of Newcastle. Structure. Economics & Livelihoods: hypothesis, Sustainable Livelihoods Framework

E N D
Livelihoods analysis, aquaculture and irrigation in India Cecile Brugere, John Lingard Department for International Development Dept. of Agricultural Economics and Food Marketing University of Newcastle
Structure • Economics & Livelihoods: hypothesis, Sustainable Livelihoods Framework • Vulnerability, assets, access, strategies • Poverty-focused aquaculture and potential beneficiaries • Aquaculture costs, resource allocation, and comparison with other income generating activities • Livelihood benefits • Constraints, Policy implications
Economics & Livelihoods: hypothesis Varying gradients of water availability Poverty and livelihood strategies adopted Potential for aquaculture interventions • 2 canals - LBP (120 miles) - Arrakankottai (40 miles) • 6 villages Head - Middle - Tail
Sustainable livelihoods framework Key H = Human capital S = Social capital N = Natural capital P = Physical capital F = Financial capital LIVELIHOOD ASSETS LIVELIHOOD OUTCOMES POLICIES, INSTITUTIONS AND PROCESSES VULNERABILITY CONTEXT - More income - Increased well-being - Reduced vulnerability - Improved food security - More sustainable use of natural resources LIVELIHOOD STRATEGIES TO - SHOCKS - TRENDS - SEASONALITY Influence & Access STRUCTURES Levels of government Laws Private Policies sector Culture Institutions PROCESSES
30 questionnaires per village (H,M,T) 3 wealth groups (R,M,P) Livelihoods analysis (quantitative) Participatory appraisal (qualitative) Secondary data analysis (qualitative) M A R K E T I N G LIVELIHOOD ASSETS Risk VULNERABILITY CONTEXT LIVELIHOOD STRATEGIES H Influence & Access POLICIES, INSTITUTIONS AND PROCESSES UNCERTAINTY S N ? F P Additions: Risk / uncertainty - Gender Gender analysis - Marketing issues Methodology of investigation LIVELIHOOD OUTCOMES
SEASONS (WET/DRY) CANAL WATER AVAILABILITY RELIGIOUS “SEASONS” Vulnerability context • SHOCKS natural: agricultural: economic: droughts, floods crop failures changed prices • TRENDS agricultural: economic: physical: social: intensification, mechanisation non-farm employment, improved welfare improved infrastructures erosion of communityvalues
Social capital HH residents Physical capital Human capital education electricity Financial capital Natural capital cattle ownership land ownership Livelihood assets (1)
Livelihood assets (2) Human capital 2 (for HH wellbeing) - food expenditure - non-food expenditure - fish consumption Physical capital - house - privately owned water sources Human capital 1 (for IGAs) - workers - education Natural capital - land - water Financial capital - savings - credit (bank loan) - cattle / goats
Access • Highlight that the notions of “assets” and “access” are very close when it comes to measuring them. • Focus on access to water sources and water uses: present summary stats
Livelihood strategies Long-term, short term, weakening (long-term) trends.
Principally crop Crop income 75% Off-farm income 75% Principally off-farm (agricultural labour) Non-farm income 75% (wage / self-employment) Principally non-farm (wage / self-empl.) Crops + non-farm 75 %, crop 75% but > off-farm and non-farm 75% but > off-farm. Farm / non-farm employment Off-farm + crops 75%, off-farm 75% but > non-farm and crops 75% but > non-farm. Farm / off-farm employment Non-farm + off-farm 75%, non-farm 75% but > crops and off-farm 75% but > crops Non-farm / off-farm employment Mixed (type 75 only): 2 main activities 75% Mix Livelihood strategies Classification - “type 75”
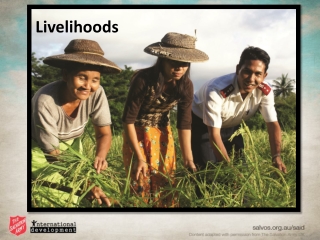
Summary livelihoods in the irrigation system more landless more agricultural labourers more poverty more cattle, larger land more physical capital more farming more wage empl. more rich landowners higher education more natural capital
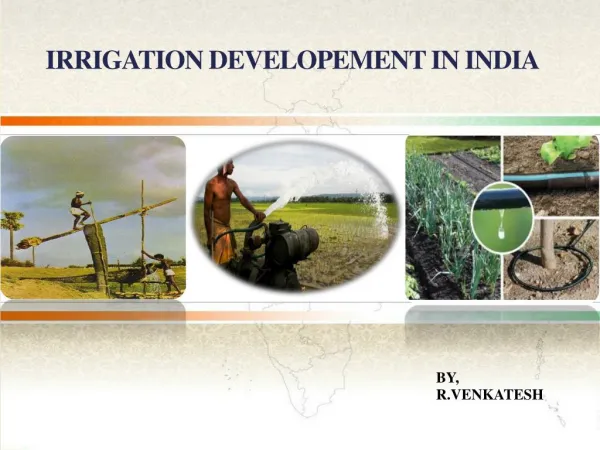
Definition: small-scale extensive / semi-intensive affordable low risk • Access • Availabilityof: - water (reliability) - fish seed - cheap, durable materials - fish food • Market demand Potential interventions: • Cages in canals H T • Cage rearing of fingerlings in flowing water H T • Stocking open wells H T • Cage fattening fish in seepage zones H T Poverty-focused aquaculture
Beneficiaries Potential conflicts
Sensitivity analysis: - Food conversion ratio - Start weight (tilapia) - Survival rate - Labour: men / women / both - Cycle length Aquaculture in canals:Costs (1) Aquaculture trials:
Aquaculture in canals:Costs (2) • Main results of sensitivity analysis • What the best options are
Optimal allocation Linear programming Competition for resources Cage aquaculture - labour - capital - cycles Farming - labour - capital - land - water - seasons Versus
Farming Vs Aquaculture: LP matrix To redo with Lindsay’s cage aqua data
Farming vs Aquaculture: Results To redo
Alternative income generating activities • Summary of main IGAs encountered in the area of study. • How does aquaculture potentially compare with these (based on a ‘qualitative’ comparison of initial investment, training, time required, flexibility, returns)
Livelihood benefits • Summarise main points raised before (target groups, types of aqua • Potential livelihood benefits (provided aqua is done in a certain way): - increased income - improved status for women - show how one “entry point” (I.e. aquaculture) can have an effect on all other corners of the pentagon)
Constraints - Policy implications Aquaculture: yes… but … profitability? … shift in resource allocation … possible with • strengthening of credit provision, in particular to women (“self-help groups”) • aquaculture awareness & knowledge transmitted to resource-poor groups • modified canal water management to target tail end of the irrigation system