Download
1 / 43
460 likes | 732 Views
Chapter 3 Atmospheric Radiative Transfer and Climate. 授課 : 3.8-3.12 自行閱讀 : 3.1-3.7. 3.8 Heuristic Model of Radiative Equilibrium. 單層大氣. 假設長波輻射全部被大氣吸收: 地表的輻射平衡: T s 4 = S(1-A)/4+ T e 4 大氣的輻射平衡: T s 4 = 2 T e 4 T s = 2 1/4 T e

E N D
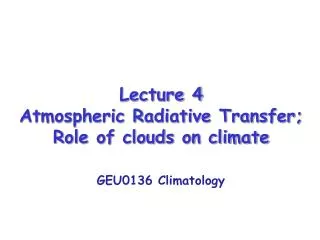
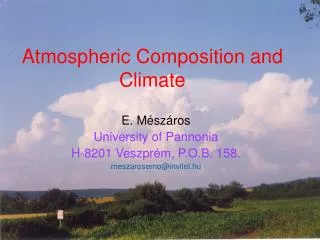
Chapter 3 Atmospheric Radiative Transfer and Climate 授課: 3.8-3.12 自行閱讀: 3.1-3.7
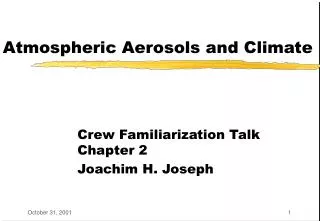
3.8 Heuristic Model of Radiative Equilibrium 單層大氣 假設長波輻射全部被大氣吸收: 地表的輻射平衡: Ts4 = S(1-A)/4+Te4 大氣的輻射平衡: Ts4 = 2Te4 Ts = 21/4Te 如果Te = 255K Ts = 303K
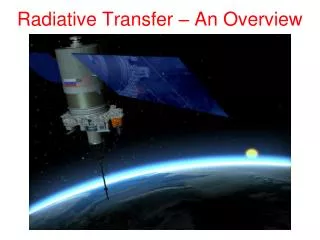
Te = 255 K 雙層大氣 Solution: TOA: Layer 1: For n layers: (prove it!) Layer 2: Surface:
平流層 Tstra Emissivity: ε 地表大氣 Tsa Emissivity: ε
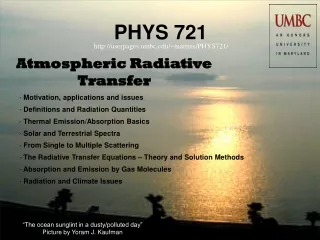
3.9 Cloud and Radiation Low and high clouds in western Scotland, looking S from Ben Challum (1025 m asl.) February 15, 2008. The linear high cloud are contrails from airplanes passing over UK. www.climate4you.com/ClimateAndClouds.htm
Evaporation from the Barents Sea north of Norway produces linear cloud systems drifting south, March 30, 2003. The clouds are seen to originate shortly south of the sea ice limit in the upper part of the picture, where the cold and dry Arctic air masses for the first time come into contact with the warm sea water. The island Jan Mayen is seen near the southern tip of the tongue of sea ice in the upper central part of the picture. Northern Norway, Finland and part of Russia is seen snow covered in the lower right part of the picture, which covers a distance of about 1000 km from south to north. www.climate4you.com/ClimateAndClouds.htm
Space shuttle view of cloud systems forming by convection of air masses over the Pacific Ocean. Evaporation consumes heat and leads to surface cooling. Higher up condensation of the water vapour releases heat, which leads to warming of the atmosphere. By convection both heat and water vapour is removed from the surface and are transported up into the atmosphere. The picture covers an horizontal distance of about 40 km from left to right. www.climate4you.com/ClimateAndClouds.htm
Cloud fraction January 2008. The cloud fraction expresses how much of the Earth is covered by clouds. Imagery by Reto Stockli, NASA's Earth Observatory, using data provided by the MODIS Atmosphere Science Team, NASA Goddard Space Flight Center. www.climate4you.com/ClimateAndClouds.htm
Clouds reflect and shade. Clouds usually have a high reflectivity, depending on water droplet size, cloud thickness and the zenith angle of the sun. Low clouds (stratocumulus) over the Barents Sea, August 18, 2003. www.climate4you.com/ClimateAndClouds.htm
High clouds (cirrus) over Folldal, central Norway. September 22, 2006 www.climate4you.com/ClimateAndClouds.htm
Mid-level clouds (altostratus) over Nordmarka, South Norway, June 26, 2005. www.climate4you.com/ClimateAndClouds.htm
Low clouds (stratocumulus) over Advent Bay, central Spitsbergen, Svalbard. July 31, 2003. www.climate4you.com/ClimateAndClouds.htm
A thunderstorm with associated vertical cloud (cumulonimbus) developing over southern Norway near Oslo. August 27, 2007. www.climate4you.com/ClimateAndClouds.htm
Low and a few high clouds over Barents Sea, September 14, 2004. The formation of clouds always occurs on a much smaller scale than can be represented by grid size used by global climate models. In addition, clouds often occur in several layers above each other, adding to the difficulty of modelling the global cloud cover correctly. www.climate4you.com/ClimateAndClouds.htm
If dropt size distribution and vertical distribution of humidity are assumed, albedo and absorption depend on total liquid water content and solar zenith angle. How do liquid water content and solar zenith angle affect cloud albedo? Why is albedo not sensitive to zenith angle when liquid water is large? Why is albedo less sensitive to liquid water content when zenith angle is large?
How do liquid water content and solar zenith angle affect cloud absorption? Is it the same as in albedo? What is the difference between overhead and near 90 degree zenith angle? Why? Why absorption decrease with increasing zenith angle? Why is it not sensitive when liquid water content is small?
水滴與冰晶對長波的影響 Whatistherelationshipbetweenemissivityandwatercontent? Cancloudbetreatedasblackbody?
3.10Radiative-ConvectiveEquilibriumTemperatureProfiles • Assuming1-Dradiative-convectiveequilibrium,onecan • estimateequilibriumtemperatureprofileduetothe • balancedradiativeforcingandconvectiveadjustment. • Whatshouldbespecifiedinthemodel? • Gasconcentrtation(whatgasesshouldweconsider?) • Surfacealbedo • Cloudtypeandfraction • Lapserate
大氣不同氣體的輻射吸收帶 (圖片來源:Ahrens,p.38,Fig. 2.11) 氧化亞氮 甲烷 氧與臭氧 吸收率 水氣 二氧化碳 大氣的所有氣體
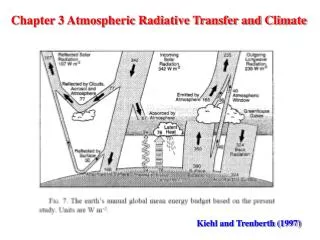
地球-大氣間的能量平衡示意圖(圖片來源:Ahrens,p.41,Fig. 2.13) 實際上能量的平衡,除了輻射能量以外,還有其他因素
Syukuro “Suki” Manabe (真鍋淑郎)
水氣+二氧化碳 水氣 水氣+二氧化碳+臭氧 水氣是最重要的溫室氣體!
SO3~LCO2 LH2O:cooling SH2O~LCO2
EnergybalanceatTOA Differencebetweenclearandcloudysky Differenceinabsorbedsolarradiation
DifferenceinOLR Or,ifthetopofcloudisabovemostofgaseousabsorber oflongwaveradiation(H20) ChangeinnetradiationatTOA • Cloudradiativeforcingdependson • thechangeinalbedo,and • thetemperatureatthecloudtop • (qualitativelycorrectifcloudtopsabove4or5km)
assume Solarconstant:1367 Clear-skyOLR:265 Surfacetemp.:288K Lapserate:6.5
The shortwave rays from the Sun are scattered in a cloud. Many of the rays return to space. The resulting "cloud albedo forcing," taken by itself, tends to cause a cooling of the Earth. Longwave rays emitted by the Earth are absorbed and reemitted by a cloud, with some rays going to the surface. Thicker arrows indicate more energy. The resulting "cloud greenhouse forcing," taken by itself, tends to cause a warming of the Earth. earthobservatory.nasa.gov/Features/Clouds/
High cloud’s radiative effect The high, thin cirrus clouds in the Earth's atmosphere act in a way similar to clear air because they are highly transparent to shortwave radiation (their cloud albedo forcing is small), but they readily absorb the outgoing longwave radiation. Like clear air, cirrus clouds absorb the Earth's radiation and then emit longwave, infrared radiation both out to space and back to the Earth's surface. Because cirrus clouds are high, and therefore cold, the energy radiated to outer space is lower than it would be without the cloud (the cloud greenhouse forcing is large). The portion of the radiation thus trapped and sent back to the Earth's surface adds to the shortwave energy from the sun and the longwave energy from the air already reaching the surface. The additional energy causes a warming of the surface and atmosphere. The overall effect of the high thin cirrus clouds then is to enhance atmospheric greenhouse warming. earthobservatory.nasa.gov/Features/Clouds/
In contrast to the warming effect of the higher clouds, low stratocumulus clouds act to cool the Earth system. Because lower clouds are much thicker than high cirrus clouds, they are not as transparent: they do not let as much solar energy reach the Earth's surface. Instead, they reflect much of the solar energy back to space (their cloud albedo forcing is large). Although stratocumulus clouds also emit longwave radiation out to space and toward the Earth's surface, they are near the surface and at almost the same temperature as the surface. Thus, they radiate at nearly the same intensity as the surface and do not greatly affect the infrared radiation emitted to space (their cloud greenhouse forcing on a planetary scale is small). On the other hand, the longwave radiation emitted downward from the base of a stratocumulus cloud does tend to warm the surface and the thin layer of air in between, but the preponderant cloud albedo forcing shields the surface from enough solar radiation that the net effect of these clouds is to cool the surface.
In contrast to both of the cloud categories previously discussed are deep convective clouds, typified by cumulonimbus clouds. A cumulonimbus cloud can be many kilometers thick, with a base near the Earth's surface and a top frequently reaching an altitude of 10 km (33,000 feet), and sometimes much higher. Because cumulonimbus cloud tops are high and cold, the energy radiated to outer space is lower than it would be without the cloud (the cloud greenhouse forcing is large). But because they also are very thick, they reflect much of the solar energy back to space (their cloud albedo forcing is also large); hence, with the reduced shortwave radiation to be absorbed, there is essentially no excess radiation to be trapped. As a consequence, overall, the cloud greenhouse and albedo forcings almost balance, and the overall effect of cumulonimbus clouds is neutral-neither warming nor cooling.
Annual average net radiation determined from 1985 to 1986. Annual average net cloud radiative forcing from 1985 to 1986. Overall, clouds have the effect of lessening the amount of heating that would otherwise be experienced at Earth's surface.