Download
1 / 17
270 likes | 546 Views
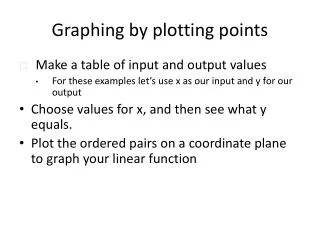
Plotting Points In A Coordinate System. How Do You Plot Points?. Before plotting points on a graph, you first have to understand the X and Y axis. The X and Y axis are number lines that run horizontally and vertically on the coordinate system.

E N D
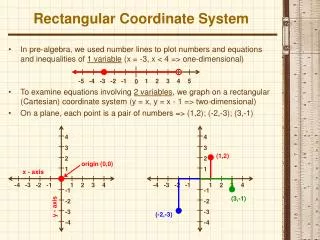
How Do You Plot Points? • Before plotting points on a graph, you first have to understand the X and Y axis. • The X and Y axis are number lines that run horizontally and vertically on the coordinate system. • An example of a set of coordinates for a point is (5,2), which is marked with the blue dot in the coordinate system on the right.
The X Axis • The X axis is the horizontal number line of the graph. • The X axis is numbered with positive coordinates on the right and negative coordinates on the left with zero in the middle.
The Y Axis • The Y axis is the vertical number line on the graph. • The Y axis is numbered with positive coordinates on the top and negative coordinates on the bottom of the X axis.
4 Quadrants • The X and Y axis together form 4 different quadrants. • The first quadrant is labeled with roman numeral I. A point in the 1st quadrant has both positive X and Y coordinates. • The second quadrant is labeled with roman numeral II. A point in the 2nd quadrant has a negative X coordinate and a positive Y coordinate. • The third quadrant is labeled with roman numeral III. A point in the 3rd quadrant has both negative X and Y coordinates. • The fourth quadrant is labeled with roman numeral IV. A point in the 4th quadrant has a positive X coordinate and a negative Y coordinates. • The green dot is the origin. The origin is where the X axis and the Y axis cross. The coordinates of the origin are (0,0) II I III IV
Plotting The Point • How do you find the point (2,3) within the coordinate system. • The first number (in this case 2) is the X coordinate. • The second number (in this case 3) is the Y coordinate. • This point would be 2 over on the X axis and 3 up on the Y axis. • The point (2,3) is labeled with a red dot in the coordinate system.
Plot This Ordered Pair (-1, 2) y 3 2 1 x 0 -1 -2 -3 -3 -2 -1 0 1 2 3
What is the ordered pair? (0,5) 6 5 4 y 3 2 1 0 x 0 1 2 3 4 5 6
What is the ordered pair? (4,0) 6 5 4 y 3 2 1 0 x 0 1 2 3 4 5 6
Plot This Ordered Pair (-3, -3) y 3 2 1 x 0 -1 -2 -3 -3 -2 -1 0 1 2 3
Plot This Ordered Pair (1, -1) y 3 2 1 x 0 -1 -2 -3 -3 -2 -1 0 1 2 3
Plot This Ordered Pair (2, -2) y 3 2 1 x 0 -1 -2 -3 -3 -2 -1 0 1 2 3
Plot This Ordered Pair (-3, -2) y 3 2 1 x 0 -1 -2 -3 -3 -2 -1 0 1 2 3
Plot That Point • Divide into two teams of approximately the same number • Plotters: Ten individuals will be point plotters. The first individual will draw the coordinate axes. • Checkers: At least two individuals will be checkers, you may have up to three checkers. • Solvers: Solvers will complete the last part of the puzzle.
Game Play • 1. Nine of the plotters will be given folded slips of paper with coordinates on them. You must keep your slip folded until it is your turn to play. • 2. The first plotter will draw the coordinate axes. You are not required to place tick marks or numbers on the axes, but you can. When the first plotter takes his seat, the second plotter unfolds their slip, notes the coordinates and gives the slip to the checkers. Then plots the point on the coordinate axis. Any plotter may add numbers, tick marks, or write the points on the board.
Game Play • 3. The checkers will check the point for accuracy. If they believe the point is correct, they do nothing. If they feel the point is incorrectly plotted, the checkers say correction and one of the checkers can correct the point. Each checker is allowed only one correction. • 4. Play continues to the next plotter who may only look at their slip when the previous plotter sits down.
Game Play • 5. Once all nine points have been plotted solvers begin play. At the beginning of the game, solvers will be given their task. They can discuss the task while play is going on, but be careful not to give the other team an advantage. When the last plotter is done, solvers will finish the task. First team to complete the task wins. • 6. If the solvers cannot solve the puzzle, they may ask for a clue. The clue comes with a one minute penalty.