Download
1 / 33
330 likes | 427 Views
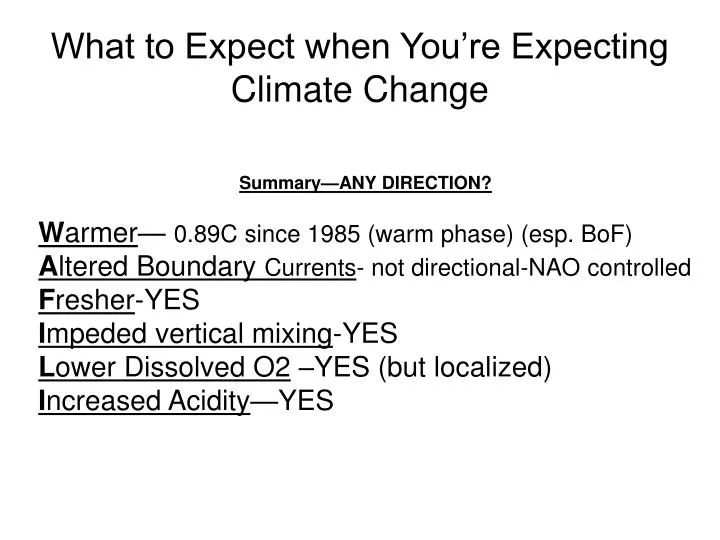
What to Expect when You’re Expecting Climate Change. Summary—ANY DIRECTION? W armer — 0.89C since 1985 (warm phase) (esp. BoF) A ltered Boundary Currents - not directional-NAO controlled F resher -YES I mpeded vertical mixing -YES L ower Dissolved O2 –YES (but localized)

E N D
What to Expect when You’re Expecting Climate Change Summary—ANY DIRECTION? Warmer— 0.89C since 1985 (warm phase) (esp. BoF) Altered Boundary Currents- not directional-NAO controlled Fresher-YES Impeded vertical mixing-YES Lower Dissolved O2 –YES (but localized) Increased Acidity—YES
Impacts on Biota Climate Loading: CO2 et al (GHG) Climate Change: Warmer,Altered Circulation, Fresher,Impeded Vertical Mixing,Lower DO, Increased Acidity-more precipitation,Increased storms Phenology Distribution Physiology Adaptation Interactions among Spp. Altered Communities Hughes, L. 2000 Climaticsignatures in ecology Trends in Ecology & Evolution, 15:56-61
Plankton Productivity GLOBAL PROJECTION: Primary productivity will increase N/S of 40 latitude by 2040-2060 (increased stratification will impede nutrient mixing in the upper water column BUT longer growing season in subpolar will result in increase) GLOBAL OBSERVED: …both LOCAL OBSERVED Phyto increase: late 60s to early 90s and then lessened; high variability with no confirmed directional change in recent years since 1997/8 (Li) • ???? responses reflect • high rates of natural variability and uncertainty Sarmiento et al. 2004 GLOBAL BIOGEOCHEMICAL CYCLES, VOL. 18, GB3003, doi:10.1029/2003GB002134 Cheung et al. 2009 F I SH and F I SHERI E S , 2009, 10, 235–251
BUT we can expect spp. Composition to be determined by water mass type– see Head and Pepin 2010 or Johnson et al 2011. Warmer waters will favor -smaller phytoplankton cells. (Li, Moran, Bodes) Food webs based on smaller-sized plankton are not as productive, because the energy flow to upper trophic levels is not as efficient Bodes et al.
Zooplankton Productivity • -No local pattern that be related to directional change. • Calanus finmarchicus decreases as stratification increases, esp. younger stages. • Calanus finmarchicus are the main source of oil-rich food for larval fish, such as cod, in our region. • If stratification continues to increase, we might expect lower availability of Calanus finmarchicus at some critical level. Currently, that level is locally unknown.
Fish and Invertebrate Productivity • PROJECTION: Climate change is expected to redistribute the global fish catch potential Cheug et al. Global Change Biology (2010) 16, 24–35 Canada: increase by ~ 5% by 2050 in a high GHG emission scenario but decrease ~8% if emissions stabilized at 2000 levels NB Cheung et al. 2011.=updated DO/A
LOCAL OBSERVATIONs: Fisheries productivity has been more influenced by overfishing than by climate change. Ability to adapt depends on high levels of variation Fishing reduces variation (e.g. size truncation, loss of sub-populations) Thus over-fished populations are less resilient to climate change. MAJOR FOCUS in literature (J.Mar Systems) Annual Proportion Depletion of Cod SSB
Extinction Vortex (Gilpin/Soule 1986) Population: Small, fragmented, smaller body size Overexploitation Loss of Genetic Diversity, Drift Reduced Population Adaptability Lower Reproduction Higher Natural Mortality ClimateChange Smaller Population Demographic Stochasticity Lower genetic variation=lower adaptability
6 cod stocks combined Ken Frank Cod stocks in 5 out of 6 areas now below this level • Higher variability • at low population size • Res rec=removes effect • of stock size • and density-dependence • Therfore-var=envtl var • Comb’n of climate and • Other pop’n aspects • (e.g. reduced size structure) • Fisheries have dominated up until now, • but since the buffering ability of fish is low---climate has more influence
“Reducing fishing mortality in the majority of fisheries, which are currently fully exploited or overexploited, is the principal feasible means of reducing the impacts of climate change.” Brander, 2007.(important fisheries guy)
Ecosystem Productivity • Forage fish and groundfish larvae compete with jellyfish/ctenophores for zooplankton • When forage fish or groundfish larvae decline, jellyfish and ctenophores have more zooplankton to eat and increase. • To exacerbate this jellyfish/ctenophores benefit in • warmer, • eutrophied water, • do not mind low levels of dissolved oxygen (Purcell, 2011). • ctenophores may present a problem in Scotian Shelf waters in the future, as has been shown for the Northeast USA (Link and Ford, 2006) Fewer competitors, lotsa nutrients, low oxygen, warmer==NO PROBLEM!!! http://publishing.cdlib.org/ucpressebooks/view?docId=kt167nb66r&chunk.id=ch17&toc.id=ch17&brand=eschol
GLOBAL PROJECTION On SS From 2005-2050 POLEWARD Demersal Spp.: 2-4km/yr Pelagic Spp.: 4-6km/yr (surface layers warm faster And pelagic spp move more) --Based on these: CHANGE IS SLOW -WSS/BoF will have more GoM, Mid Atlantic Bight spp. -but ESS will become southern limit of current spp. Distribution Pereira, et al. Science 330, 1496 (2010);
Species Distribution What about COD? much more tolerant than previously considered. Prefer 2-12C?? Maybe not. Using electronic tags, Righton et al (2010) -cod were - thermal niche ranged from -1.5 to 19C, -averaged 12C, -1-8C during the spawning season. -On daily basis, cod moved through wide C range Former dominance and widespread distribution In temperate/ boreal systems= their adaptability
Fig. X. Match-Mis Match in Marine environment. Many fish are adapted to spawn so that peak larvae abundance will coincide with their copepod prey. If copepod peak abundance occurs earlier due to climate-induced shift in seasonal cues, and fish do not adapt in the same direction, peak abundances between predator and prey will be mis-match. Timing of Seasonal Events (phenology) • The ability to adapt seasonal events (such as reproduction, migration) to climate change can be generally predicted if the seasonal cues (e.g. temperature, light) are known • ….the problem is if Predator/Prey Phenology is MISMATCHED. key taxa = plankton (base of the food chain). Phenological changes have been globally observed but locally, no changes since 1998 have been observed.
Chemistry Scotian Shelf water has become more acidic since the 1930’s and is predicted to become increasingly so due to increased CO2. The issue is compounded by the expected increase in temperature causing a decrease in the solubility of CO2. Acidification effects on the food chain are currently understudied. Komiko Azestu-Scott, DFO
Chemistry Hypoxia (low amounts of dissolved oxygen) is not anticipated to be a problem in the offshore but remains a potential concern in embayments/harbours etc. However, if the flow of highly oxygenated water from Labrador current is slower (due to the expected enduring positive NAO), dissolved oxygen may be an issue near bottom. Fig. X . Behaviour and physiology responses of marine organisms to various oxygen saturation levels. SOURCE: Ekau et al. 2010
Summary—ANY DIRECTION? Warmer— 0.89C since 1985 (warm phase) Altered Boundary Currents-So far, not directional-NAO controlled Fresher-YES Impeded vertical mixing-YES Lower Dissolved O2 –YES (but localized) Increased Acidity—YES PROJECTIONS:….SS- slow and indirect change ANTICIPATED; Faster in GoM Increased stratification may impede vertical mixing, and or cause seasonal events to occur earlier, and, as a result may disrupt trophic interactions. Changes in seasonal events, particularly at the base of the food chain, should be further investigated due to the anticipated re-organization of the food chain In general, CC will select for smaller, acid-tolerant (tough) organisms. RESEARCH: -Organisms have adapted to temperature over millennia, but they are not as easily adaptable to acidic conditions. -Lower trophic levels—what are they up to???? -Buffering ability of highly exploited fish should be studied, climate effects will start to influence the recruitment stage
Common Responses in NW Ecosystem researchin support of Ecosystem Approach to ManagementNancy Shackell, DFO
Ecosystem-Approach to ManagementStep 1: Ecosystem Assessment
Climate IMPACTS Ecosystem Integrity Economic Implications DRIVERS/ PRESSURE RESPONSES Policy and Legislation Programs and Initiatives -Eco Approach to Mgmt -Climate Change Adaptation STATE Trophic Structure Size Structure
Across Region: Since early 1990s, many studies that have examined ecosystem response to fishing and climate…..to make a long story short……
Emerging North Atlantic Patterns NF: Baltic Sea Trophic Cascade: Decline in Top Predators; Changing Climate WSS Black Sea Baltic Sea Over the past 10 yrs… Common Patterns : Heavy Fishing will dominate ecosystems, Climate modifies
Common Patterns across Large-Scale Ecosystems in the Northwest AtlanticNancy Shackell1*, Alida Bundy1, Janet Nye2, Jason Link2, 1Fisheries and Oceans, Canada, Bedford Institute of Oceanography, PO Box 1006, Dartmouth, NS B2Y 4A2, Canada; National Marine Fisheries Service, Northeast Fisheries Science Center, Woods Hole Laboratory, 166 Water Street, Woods Hole, MA 02543, USA.;3 NOAA NMFS Northeast Fisheries Science Center, Chief, Oceanography Branch8 Tarzwell Drive,Narragansett, RI 02882 USAICES J Mar Sci (accepted)
What have we learned? • Heavy Fishing dominates ecosystem, Climate modifies • Decline in ESS/ VERY partial recovery 20 yrs later • Compensation ELSEWHERE in predatory groundfish • SO- Colder species-poor take longer to recover than Warmer species-rich ecosystems because • demographic rates are low, • not as many species to replace them • 3) Common Responses but subtle Differences • and Now we’ll look briefly at a big signals • SIZE STRUCTURE • TROPHIC STRUCTURE
Decline in: Biomass, Size and/or spatial contraction==Decreased Buffering Capacity thru Effcts on productivity and pop’n connectivity
Size Structure …from Size Selective Fishing Little FISHING Heavy FISHING Fig. 9 Effect of exploitation rate on spawning stock (http://www.fao.org/docrep/005/AC749E/AC749E07.htm#ch7
Does Size Matter? • Loss of potential accumulation of biomass to get larger fish (preferred choice of fishing industry) • All kinds of ecological effects (lower diversity of size classes, maternal) • Reduced predatory abilities
Consequences of declines in Northwest Atlantic fish body size Fecundity Abundance Home range Mortality • Body size is a key functional trait that links patterns in macroecology • Critical to fecundity, mortality, turnover rates, etc. • With truncation, potential for increased interspecific competition • Predation often depends on predator:prey size Attribute Body mass Jon Fisher Graphics™
Size Contraction Example Of lower Phenotypic Var==lowers buffering ability =>reduced Pop structure - demographic & parental effects …what is risk of recovering grdfish to increase in Climate variability?
SELECTION=BAD • Species/Stock/Size/Season/Sex/Space • BALANCED EXPLOITATION=GOOD Zhou et al. 2010 Ecosystem-based fisheries management requires a change to the selective fishing philosophy. PNAS Early Edition