Download
1 / 11
110 likes | 128 Views
ON THE ECOLOGICAL VEGETATION MAPS OF THE RIVER NIGER DELTA, NIGERIA BY Prof Imoh Ukpong Department of Geography & Regional Planning University of Uyo P.M.B. 1017, Uyo Akwa Ibom State, Nigeria E-mail: imohukpong@yahoo.com

E N D
ON THE ECOLOGICAL VEGETATION MAPS OF THE RIVER NIGER DELTA, NIGERIA BY Prof Imoh Ukpong Department of Geography & Regional Planning University of Uyo P.M.B. 1017, Uyo Akwa Ibom State, Nigeria E-mail: imohukpong@yahoo.com *19th Annual Conference of the Nigerian Cartographic Association, Benin City, 6th-9th November, 1997. Title of Paper:Ecological Vegetation Maps of the Niger Delta.
WHAT IS ECOLOGICAL VEGETATION MAP? • Maps that show the geographical distribution of vegetation types in relation to one or more features or attributes of the environment. • Vegetation Maps that rely on continuous availability of data regularly updated for easy retrieval. • Vegetation maps that are produced for specific ecosystems. • Maps that provide useful tool in environmental management and conservation.
IMPORTANCE OF GIS IN ECOLOGICAL VEGETATION MAPPING • The future use of an ecological vegetation map depends on an efficient information storage, retrieval and distribution system. • Such a system should permit the manipulation of large amounts of spatially oriented data. • GIS meets the above requirements. • GIS allows manipulation of e.g. spatially oriented environmental information for the determination of the most efficient and effective areas to implement management decisions.
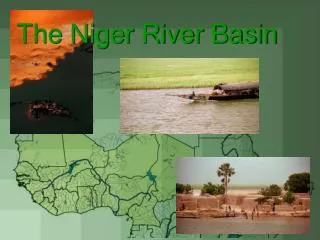
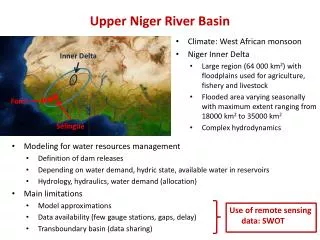
THE RIVER NIGER DELTA • The Niger Delta, 70,000 km2 is one of the world’s largest wetlands’ • It contains the third largest mangrove forest in the world and the largest in Africa • The Niger Delta States in Nigeria produce about 75% of Nigeria’s petroleum and invariably suffer the highest degree of environmental degradation • This presentation discusses the potential components of ecological vegetation maps that could be produced for the Niger Delta mangroves and how GIS could be used to help adopt appropriate conservation and management techniques.
Frequency of species occurrence Number of species/stand Index of stand similarity Index of stand diversity Species Density/unit area Tree height Tree basal area Crown cover Density of saplings/stand Density of saplings/unit area 11. Density of pneumatophores/stand 12. Density of pneumatophores/unit area 13. Density of die – back 14. Basal area of dead trees 15. Cover of ground layer species 16. Cover of understorey species. 17. Density of groundlayer stems 18. Density of understorey stems. 19. Percent canopy gap SPECIES/VEGETATION ATTRIBUTES THAT COULD BE USED IN ECOLOGICAL VEGETATION BASE MAPS
Mean monthly temperature Mean annual temperature Mean daily temperature of the coldest months Absolute temperature minimum Mean daily maximum temperature of the warmest month Absolute temperature maximum Mean daily temperature variations Mean monthly rainfall Mean annual rainfall Relative humid season Swamp elevation above sea level Swamp accretion rates\ Channel sedimentation rates Particle-size composition of mud/soil Moisture content of mud/soil Bulk density of mud/soil 17. Moisture at Saturation of soil 18. Water holding capacity 19. Mean monthly salinity (Soil and soil water) 20. Mean annual salinity (soil and soil water) 21. Mean daily salinity (soil and soil water) 22. Levels of exchangeable bases (soil and soil water) 23. Levels of heavy metals (soil and soil water) 24. Levels of phosphorus, nitrogen and organic matter (soil) 25. pH levels and exchangeable acidity 26. Frequency of tides 27. Height of lowed annual tides 28. Height of highest annual tides 29. Mean tide level 30. Water table height at low tide 31. Height of forest floor above mean low water 32. Height of obstruction to tide inundation ENVIRONMENTAL DIAGRAM FOR MANGROVE ECOSYSTEM
CHARACTERISTICS OF THE ECOLOGICAL VEGETATION MAP • Ecological vegetation maps help to condense the complexity of the environment into a living space, by giving it an ecological order. • Two types of systematically prepared ecological vegetation maps are of relevance to the Niger Delta area: • Single – quality maps: This is produced for an environmental feature that is glaringly significant in the management of a vegetation community e.g., the relationship of salinity to the mangrove genera. • Multi-quality maps: This seeks to portray the ecological conditions of an area.
Many multi-quality ecological vegetation maps could be drawn for the Niger Delta area to relate the vegetation to several environmental features. The following features are suggested: • salinity; cation concentrations in water and soil; soil texture and colour; topographic variation; habitat classes or site types; superficial deposits, soil types etc. It the maps must contain features resulting from human activities, the following are suggested: • contents of heavy metal (in soil and water) industrial effluent, domestic effluents, water temperature etc.
ECOLOGICAL SIGNIFICANCE OF THE MAPS • The ecological interpretation help to determine in what manner the mangrove ecosystem can serve to improve and maintain environmental qualities for the physical well-being of man. • The approach to the ecological significance, being anthropocentric, the following issues could be quantified into the legend of the maps, using suitable indices: Erosion, flooding fisheries depletion, habitat degradation, deforestation, biodiversity loss, oil pollution, gas flaring, industrial pollution, fertilizer pollution, solid waste, toxic and hazardous substances, sewage etc.
EFFICIENCY OF THE MAPS An efficient ecological vegetation map of the Niger Delta should attempt to give answers to the following environmental issues. • Is the carrying capacity of the available swamps being exceeded? • What is the prevailing erosion type under the present management technique? • What are the chances of pollution control under different types of management • What would be the mangroves productivity (biomass unit area) under different types of management? • What methods should be adopted for conserving mangrove biodiversity and other renewable resources? • Which pollutants are most toxic in cumulative effect? • Where should a monitored mangrove reserve be located for minimum disturbance? • Is the map of practical significance?
CONCLUSION The GIS software however depend upon data from existing maps. Therefore few of these systems can be applied to ecological mapping for environmental conservation, with the probable exception of Map Analysis Package and Comprehensive Inventory and Evaluation Systems. Considering the urgent need to preserve the Niger Delta environment, multi-quality ecological vegetation maps appear to be the basic tools for assessment. THANK YOU