Download

1 / 28
340 likes | 396 Views
Population Pharmacokinetics. Dr Mohammad Issa Saleh. Population Pharmacokinetics. “The study of the sources and correlates of variability in drug concentrations among individuals who represent the target population that ultimately receive relevant doses of a drug of interest”

E N D
Population Pharmacokinetics Dr Mohammad Issa Saleh
Population Pharmacokinetics “The study of the sources and correlates of variability in drug concentrations among individuals who represent the target population that ultimately receive relevant doses of a drug of interest” FDA Guidance for Industry, 1999
Population Pharmacokinetics role • Individualizing the dose to get optimum benefit • Designing dosing guidelines for drug labelling • Communicating important aspects of drug clinical pharmacology to regulatory bodies • Understanding the effect of competing dosing regimens on outcomes of clinical trials • Helps the quantitative assessment of typical pharmacokinetic parameters, and the between-individual and residual variability in drug absorption, distribution, metabolism, and excretion
Sources of variability • Sources of variation that contribute to differences between expectation and outcome are usually categorized as inter-individual and residual in nature • The parameter values of a particular patient will differ from the expected values because of inter-individual variability • Residual variation includes intra-individual variability (random changes in a patient’s parameter values over time), inter-occasion variability (change in a patient’s parameter from one occasion [period] to another), drug concentration measurement error, and model misspecification errors
Two Types of Datasets to Consider • “Rich” data - intensive sampling from each subject. May be possible to fit each subject’s data separately. • “Sparse” data - only a small number of samples obtained from each subject. Not possible to fit each subject’s data separately.
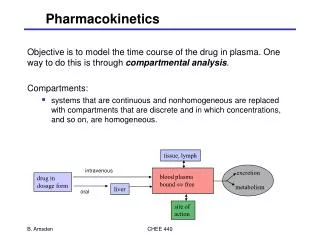
PK modeling single subject • E.g.: A simple Pk model • Ri = infusion rate • Cl = drug clearance • k =elimination rate constant • = measurement error, intra-individual error Drug Conc N(0,) Time
Residual error • The difference between observed concentration and model predicted concentration • Residuals are usually assumed to be independent, normally distributed with mean zero and variance of σ2 N(0,)
Population Pharmacokinetics • It seeks to obtain relevant pharmacokinetic information in patients who are representative of the target population to be treated with the drug • It recognizes sources of variability, such as inter-subject, intra-subject, and inter-occasion, as important features that should be identified and quantified during drug development or evaluation • It seeks to explain variability by identifying factors of demographic, pathophysiologic, environmental, or drug-related origin that may influence the pharmacokinetic behaviour of a drug • It seeks to quantitatively estimate the magnitude of the unexplained part of the variability in the patient population
Why PK parameter vary among individuals? • Pharmacokinetic variability is affected by several factors such as: • demographics (eg. gender, body weight, surface area, age, and race etc.) • environmental factors (eg. smoking, diet, and exposure to pollutants etc.) • genetic phenotype that affects the clearance of drugs (eg. CYP2D6, 2C19, 2C9, 2A6 etc.) • drug–drug interactions • physiologic factors (eg. pregnancy) • pathophysiologic factors (eg. renal and hepatic impairment) • Other factors (eg. circadian rhythm, adherence, food effect and the timing of meals, activity, posture)Determining the above issues provides a outline for defining optimum dosing strategies in a population, a subpopulation, or for the individual patient • Determining the above issues provides a outline for defining optimum dosing strategies in a population, a subpopulation, or for the individual patient
Population Pharmacokinetics: advantages • Allows to use both sparsely and intensively sampled data • Helps to carry out the pharmacokinetic investigations in special populations such as neonates, elderly, patients with AIDS, critical care patients, and those with cancer etc., where the number of samples to be obtained per subject is limited because of ethical and medical concerns • During drug development, relatively few samples can be obtained from patients participating in Phase II and III studies for the determination of the pharmacokinetics of a drug in the relevant population and for the determination of the relationship between dose, exposure (concentration), and response/safety • The sparse sampling approach for characterizing PopPK yields better estimates of inter-subject variability than traditional approaches that yield positively biased estimates of this measure of dispersion. A combination of accurate and precise estimates of inter-subject variability and the mean parameter value for a drug is useful for selecting an initial dose strategy for drug therapy in a patient and dosage individualization • The analyses of sparse samples collected for PopPK analysis have been reported to be cost-effective and provide not only an opportunity to estimate variability, but also to identify its sources.
Population Pharmacokinetics: disadvantages • A disadvantage of the PopPK approach is that it requires skilled pharmacokineticists and pharmacometricians who are able to implement the mathematical and statistical techniques used in the estimation of PopPK parameters.
Population Pharmacokinetics • Naïve average data approach • Naïve pooled data analysis • Two stage approach • Nonlinear mixed effects model
Naïve average data approach • It is common practice in preclinical and clinical pharmacokinetics to perform studies in which the drug administration as well as the sampling schedules are identical for all subjects • For this type of analysis there are as many data points as there are individuals at each sampling time
Naïve average data approach • Analysis of such data using the naive averaging of data (NAD) approach consists of the following procedure: • Compute the average value of the data for each sampling time • A PK model is fitted to the mean-data while estimating the best-fit PK parameter values
Naïve pooled data analysis • Sheiner and Beal proposed the term naive pooled data (NPD) approach for the method in which all data from all individuals are considered as arising from one unique individual
Two-Stage Approach • With this approach, individual parameters are estimated in the first stage by separately fitting each subject’s data, then in the second stage obtaining parameters across individuals, thus obtaining population parameter estimates • Fitting individuals • Averaging individuals’ PK parameters; calculate variances
Two-Stage Approach:1-Fitting individuals Subject 1: Cl1, K1 Subject 2: Cl2, K2 Drug Conc Subject 3: Cl3, K3 Subject 4: Cl4, K4 Time
Two-Stage Approach:1-Fitting individuals Drug Conc Time
Two-Stage Approach:2-Averaging individuals’ PK parameters; calculate variances
Problems with “Two-stage” analysis • Ethical concerns • 2-stage analysis requires ‘rich’ data sets (e.g., 6-10 concentration v. time samples) • Difficult to justify in seriously ill patients & in special populations (pediatrics, elderly, etc.) • High Cost • Little opportunity for serendipity. Optimization of study design removes variables, which minimizes the likelihood of finding unexpected relationships (e.g., effect of hepatic impairment on CL for drug that is exclusively cleared in the urine).
Mixed-Effects Modeling Approach • Simultaneously fits “Pop PK” model to all data collected from the study The Pop PK model is structured to: • Define mean values for PK parameters (e.g,. CL, V) and define covariates (parameters & covariates are the “fixed-effects” of the system) • Account for random variation (“random effects”: inter-individual variability [person-to-person variability within a group], inter-occasion variability [day-to-day variability], and residual variability [model misspecification, assay error])
Mixed-Effects Modeling Approach • Using Mixed effects modeling the following are determined: • Theta (θ): Population estimate for the PK parameter • Eta (η): Describes inter & intra-individual variability. η will have a mean of zero and a variance of ω2 • Epsilon, Err (ε): Residual variability (assay, etc). ε will have a mean of zero and a variance of σ2
Population pharmacokinetic model of digoxin in older Chinese patients and its application in clinical practiceXiao-dan ZHOU, Yan GAO, Zheng GUAN, Zhong-dong LI, Jun LI Aim: To establish a population pharmacokinetic (PPK) model of digoxin in older Chinese patients to provide a reference for individual medication in clinical practice. Methods: Serum concentrations of digoxin and clinically related data including gender, age, weight (WT), serum creatinine (Cr), alanine aminotransferase (ALT), aspartate aminotransferase (AST), blood urea nitrogen (BUN), albumin (ALB), and co-administration were retrospectively collected from 119 older patients taking digoxin orally for more than 7 d. NONMEM software was used to get PPK parameter values, to set up a final model, and to assess the models in clinical practice. Results: Spironolactone (SPI), WT, and Cr markedly affected the clearance rate of digoxin. The final model formula is Cl/F=5.9×[1– 0.412×SPI]×[1–0.0101×(WT–62.9 )]×[1–0.0012×(Cr–126.8 )] (L/h); Ka=1.63 (h-1); Vd/F=550 (L). The population estimates for Cl/ F and Vd/F were 5.9 L/h and 550 L, respectively. The interindividual variabilities (CV) were 49.0% for Cl/F and 94.3% for Vd/F. The residual variability (SD) between observed and predicted concentrations was 0.365 μg/L. The difference between the objective function value and the primitive function value was less than 3.84 (P>0.05) by intra-validation. Clinical applications indicated that the percent of difference between the predicted concentrations estimated by the PPK final model and the observed concentrations were -4.3%−+25%. Correlation analysis displayed that there was a linear correlation between observated and predicted values (y=1.35x+0.39, r=0.9639, P<0.0001). Conclusion: The PPK final model of digoxin in older Chinese patients can be established using the NONMEM software, which can be applied in clinical practice.
What is the interpretation of the results? • Population estimated parameters: • Cl/ F = 5.9 L/h • Vd/F = 550 L • Ka=1.63 hr-1 • Population estimated concentrations: • Where Vd/F, Ka, and K are population estimated PK parameters K = (Cl/F)/(Vd/F)
What is the interpretation of the results? • Individual (ith individual) estimated parameters: • (Cl/F)i=5.9×[1– 0.412×SPI]×[1–0.0101×(WT–62.9 )]×[1–0.0012×(Cr–126.8 )]+ η • (Vd/F)i = 550+ η • (Ka)i=1.63+ η • Where SPI, WT and Cr are characteristics specific to the individual • η is the random effects models for stochastic variation in individual parameter values
What is the interpretation of the results? • Individual estimated concentrations: • Where Vd/F, Ka, and K are individual estimated PK parameters
What is the interpretation of the results? • The observed concentration is described as: • Where Vd/F, Ka, and K are individual estimated PK parameters • ε is the residual variability
Describe the variability? • Interindividual variability: η has a mean of zero and a CV% of 49.0% for Cl/F and 94.3% for Vd/F • Residual variability: • ε has a mean of zero and a standard deviation of 0.365 μg/L