Download
1 / 23
230 likes | 416 Views
Climate Change & Forests. Economic Impacts on Timber Values in the Mid-Atlantic (MAR) Region. a framework for analysis by Gauri Shankar Guha. Overview. Climate change economics variable sectoral vulnerabilities review of recent work (models of climate change impacts)

E N D
Climate Change & Forests Economic Impacts on Timber Values in the Mid-Atlantic (MAR) Region a framework for analysis by Gauri Shankar Guha
Overview • Climate change economics • variable sectoral vulnerabilities • review of recent work (models of climate change impacts) • The ecological response system • GCMs Biogeographical / Biogeochemical models • The economic model… multi-species dynamic optimization • The simulation…terminal year… various ecological scenarios… various economic growth scenarios… use of uncertainty • Deliverables • Changes in regional welfare, resulting from simulations • Disaggregated economic & ecological scenario maps • Query based data retrieval systems (QB Econ, QB FIA)
The Mid-Atlantic Regional Assessment (MARA) • US Global Change Research Program: 19 regional assessments following worldwide scientific concern about sectoral vulnerability to climate change • effect of climate change/ variability on people & surroundings • how people may adapt and reduce vulnerability • how research may improve decision-making • Mid-Atlantic Region • 358 counties in 8 states and Washington, DC • land =5%, • pop = 15%, • income = 13%, (of total US)
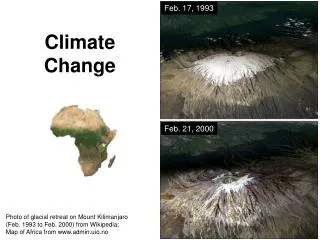
Standard evidence of global warming shown in climate change literature
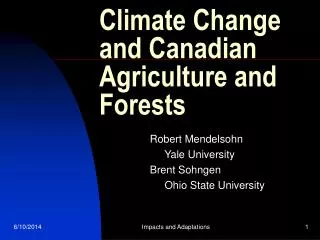
Impacts of climate change on forest sector • Forests supply multiple market /non-market goods and services • Capture implications for a regional economy • Anthropogenic climate change • rain, temperature, soil productivity • issue of CO2 fertilization • Changes soil characteristics and the competitive balance amongst species • recomposition & migration of forests • change in rate of biomass accumulation
Review of recent work (1) Selected studies • Solomon (1986) – limited impact • Binkley (1988) – growth = f(temp), timber trade model • Cline (1992) – significant losses • Callaway et al (1994) – PV of losses $294 billion (methodological error) • Joyce (1995) – increased harvests, price offsets (TEM + TAMM) • Adams & Haynes (1996) – projects regional harvest paths, based on demand-supply-inventory model, impact factor • Perez-Garcia et al (1997) – productivity increases • Winnett (1998) – poleward migration • Sohngen & Mendelsohn (1999) – multispecies ecological-economic model, assuming linearities and steady growth • Mills et al (2000) – productivity change and redistribution, resulting from climate change over broad forest classes
Review of recent work (2)methodological limitations • sophisticated economic models tend to under-represent ecological complexities • complex ecological models make over-simplified economic assumptions (not uncommon in global warming literature, for e.g., C–E models of GHG mitigation use either top-down, or bottom-up approach, with similar effect)
examples of limitations in recent work • instant dieback, followed by regrowth of same species • ecosystem productivity alone (no species change) • alternate opportunities available to the land, over time • timber market adjustments in response to climate change • economic growth scenarios • uncertainties in climate vectors/ ecological response • non-linearities in climate change variables (temp, rain)
Model Schema GCM Hadley, UKMO, CCC Ecological Response Distribution (Vemap) Productivity (Atlas) Economic Impact Dynamic Optimization Uncertainty Analysis
Climate forecasts for MAR from Global Circulation Models (GCM) These 2 GCMs were selected since their in-sample forecast best matched the observed means & standard deviations in the MAR. (viz. minimum & maximum temperatures, and rainfalls in the sample period: 1960 – 1989). In general, all the 7 GCMs used by the NAST show fairly consistent increasing trends in temperature forecasts; while there is greater variability in rainfall forecasts. This is also true for the 3 GCMs tested in MAR (2 are shown, while the 3rd is UKMO).
Ecological Response • Biogeographical • species migration • Biogeochemical • productivity change
Ecological Response:Biogeographical • Regional forest types have evolved over the centuries or millenia based on the comparative advantage that the local biome enjoys over other species in a stable climate regime. A biome is defined by a set of dominant species, but also contains a number of co-existing species that are not prolific in the given environment. However, the dominance of species appears to operate within fairly small ranges of physical conditions, hence biomes have narrow tolerances to climatic change. • The direct influences of changes in temperature and rainfall, also lead to indirect influences like changes in nutrient cycles, soil chemistry and availability of symbiotic micro-organisms. When these changes are beyond the tolerances of the existing biomes, they are replaced by new biomes in the equilibrium state. • Basis: Climate change atlas of 80 tree species in the eastern US under 5 GCMs - GISS, GFDL, Hadley, CCC, UKMO, (developed by Iverson-Prasad, at USDA/FS, Northeastern Research Station)
Ecological Response:Biogeochemical • Changes in the physical environment also effects the rate of biomass accumulation and thus the vegetative growth of trees, leading to a change in productivity. This is different across species, providing both positively sloped, as well as negatively sloped response functions. • Results in different rates of harvestible timber, and carbon storage • Basis: yield functions under different GCM scenarios (Hadley, CCC, UKMO ) from ATLAS (developed by J Mills & others at Portland, OR) base area - FIADB retrieval system USDA/FS – Northcentral Research Station
Linear transformation of a Theoretical Logistic Function yield temp time yield time temp, rain Positive Normal Negative
Non-linear transformation of a Theoretical Logistic Function yield temp time yield time temp, rain Positive Normal Negative
Economic Model • Maximize regional welfare (sum of producer and consumer surpluses) dynamically over time • Regional welfare is a function of the NPV of the stream of returns from timber harvests, net of replanting costs, and land “rent” • Constraints on • forest size • opportunity cost of land • Impacts are reflected by differences in projected harvest paths based on “area-shift” and modified “yield functions” due to climate change • Introduces uncertainty
Formulation: Welfare Maximize welfare: W(H,V) = (D(Q) ) dQ Q = Q(H, V(a)) where D(.) is Marshallian demand; Q(.) is quantity harvested; V(a) is a twice- differentiable, concave yield function; (a) is the age of the timber.
Formulation: Objective where b is the unit cost of replanting (assumed to be a scalar) G is the annual replanting / forestation acreage R is land-rent X represents the current forest stock in acres and where, the superscript qa (quality adjusted) refers to price equivalence and i are the species specific weights, based on quality attributes, such that the harvest price is made uniform across species
Formulation: Constraints Forest stock: Change in forest stock depends on harvest and replanting = - Hi(t) + Gi(t) Opportunity cost of land: Value of any planned rotation must exceed returns from the next best activity This equation represents unit area evaluation, where, tis rotation length, A is return from alternate landuse, V is yield, and b is the unit planting cost.
Solution Issues • Revenue determination • price * harvest acres (H) * volume/ acre • relate harvest to age profile • Replant cost • replant acres (R) * unit cost • Land rent • capital costs (forest area * cost per acre) • Constraints • stock: F(t+1) = F(t) – H (t) + R (t) • opportunity cost: PV (future harvests) > Alternate
Data Issues • Initial forest Stock • Species inventory, by age classes • Yield Function • Rotation length • Demand function • Initial price • Unit planting cost • Discount rate