Download
1 / 5
50 likes | 61 Views
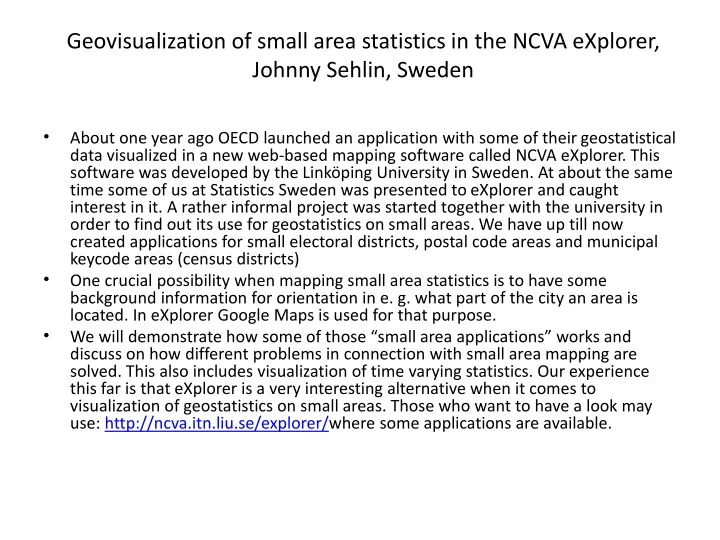
Geovisualization of small area statistics in the NCVA eXplorer , Johnny Sehlin, Sweden.

E N D
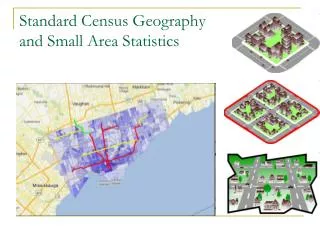
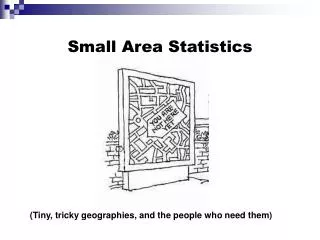
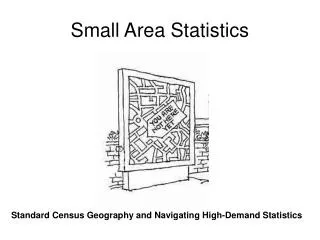
Geovisualization of small area statistics in the NCVA eXplorer, Johnny Sehlin, Sweden • About one year ago OECD launched an application with some of their geostatistical data visualized in a new web-based mapping software called NCVA eXplorer. This software was developed by the Linköping University in Sweden. At about the same time some of us at Statistics Sweden was presented to eXplorer and caught interest in it. A rather informal project was started together with the university in order to find out its use for geostatistics on small areas. We have up till now created applications for small electoral districts, postal code areas and municipal keycode areas (census districts) • One crucial possibility when mapping small area statistics is to have some background information for orientation in e. g. what part of the city an area is located. In eXplorer Google Maps is used for that purpose. • We will demonstrate how some of those “small area applications” works and discuss on how different problems in connection with small area mapping are solved. This also includes visualization of time varying statistics. Our experience this far is that eXplorer is a very interesting alternative when it comes to visualization of geostatistics on small areas. Those who want to have a look may use: http://ncva.itn.liu.se/explorer/where some applications are available.
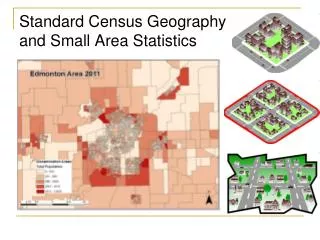
Voting districts in the General elections 2006 In Jönköping county