Download
1 / 3
70 likes | 301 Views
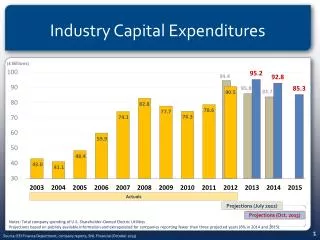
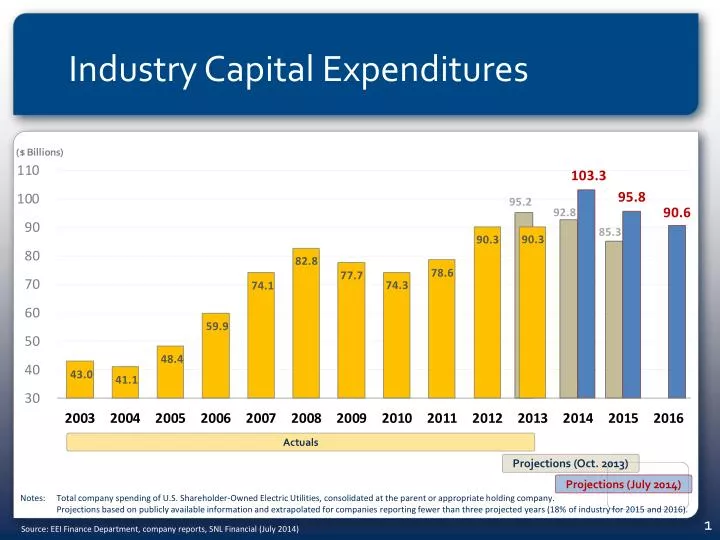
Industry Capital Expenditures. Actuals. Projections (Oct. 2013). Projections (July 2014). Notes: Total company spending of U.S . Shareholder-Owned Electric Utilities, consolidated at the parent or appropriate holding company.

E N D
Industry Capital Expenditures Actuals Projections(Oct. 2013) Projections(July 2014) Notes: Total company spending of U.S. Shareholder-Owned Electric Utilities, consolidated at the parent or appropriate holding company. Projections based on publicly available information and extrapolated for companiesreporting fewer than three projected years (18% of industry for 2015 and 2016). 1 Source: EEI Finance Department, company reports, SNL Financial (July 2014)
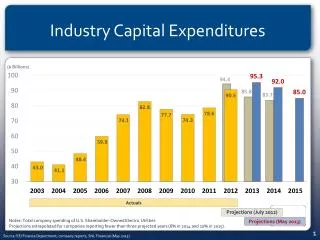
Industry Capital Expenditures Actuals Projections(July 2014) Notes: Total company spending of U.S. Shareholder-Owned Electric Utilities, consolidated at the parent or appropriate holding company. Projections based on publicly available information and extrapolated for companiesreporting fewer than three projected years (18% of industry for 2015 and 2016). 2 Source: EEI Finance Department, company reports, SNL Financial (July 2014)
Projected Functional CapEx 2012P 2013P as of August 2012 as of October 2013 $94.4 B $95.2 B Generation Update Planned for Late Summer 2014 Distribution Transmission Gas-Related Environment Other Notes: Total company functional spending of U.S. Shareholder-Owned Electric Utilities Projections based on publicly available information and extrapolated for companiesnot reporting functional detail (1.6%). Source: EEI Finance Department, company reports (October 2013)