Download
1 / 32
320 likes | 431 Views
Natural Language to Machine Readable Format. By: Damian Tamayo Presentation 1 – Oct. 12, 2009 CIS 895 – MSE Project. Documentation. cis.ksu.edu/~dtamayo What I want to do, Where I want to go Vision Document – Project Overview My plan to get there Project Plan Gantt Chart

E N D
Natural Language to Machine Readable Format By: Damian Tamayo Presentation 1 – Oct. 12, 2009 CIS 895 – MSE Project
Documentation • cis.ksu.edu/~dtamayo • What I want to do, Where I want to go • Vision Document – Project Overview • My plan to get there • Project Plan • Gantt Chart • Standards/Guidelines • SQA Plan
Overview • Project Overview • The Goal • Project Requirements • Examples – Simulated output • Parsing • Logical Output • Semantics • PPOS • SQA • Cost Estimation • Project Schedule • Questions
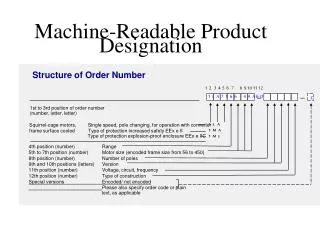
Project Overview - Goal • Employ natural language processing to detect structure and semantics of a sentence in order to output correct logic so that it can be in machine readable format • accurately represent the inputted text • understand the parsed structure that is represented • Ex: Two cars entered the same intersection from different roadways
Project Requirements • Program Requirements • Main focus of MSE project • Proprietary POS Tagger • Ensure correct Input
Program Requirements • Req1 (Critical) GUI • A.)POS tagger output tab • B.(Critical) User input (ui) tab/process -> split sentences tab • C.) Split sentences tab -> hold process ui • D.(Critical) tab for internal representation • E.(Critical) ontology tab for showing logic • F.(Critical)PPOS tagger – ensure input
Program Reqs (cont) • Req2 – error messages/servers not running • Req3 – UI free from grammatical errors • Req4 – UI not ambigous • Req5 – UI can be multiple sentences
Program Reqs (cont) • Req6 – Dynamic UI • Req7 – Correct punctuation • Req8 (Critical) – Internal Rep correct • Req9 – UI not use pronouns • Req10 – UI not use inference
PPOS Req • PReq1 – PPOS tab -> UI manually tag • A.) Supersedes other POS taggers • B.) Return parse of sentence • PReq2 – tag options similar to other POS taggers • PReq3 – Dynamic tagging
Expected Logical Rep • If you are entering a through street or highway at which there are stop signs, you must stop completely and proceed when you can do so without interfering with other traffic.
SQA • Supervisory Committee • Attend presentations • Provide feedback • Major Professor • Meet with developer/weekly basis • Developer • Produce product in given timeframe • Meet weekly w/ Major Professor
SQA (cont) • Documentation and Coding Standards • Existing Project • Adding onto • Follow existing examples • Metrics • COCOMO II • Reviews Audits • Michael Marlen – chief advisor
SQA (cont) • Testing • Dynamic Basis • As code is integrated • Tools • MS Visual Studio 2008 • TortoiseSVN • Source Control
Cost Estimation • COCOMO II • Effort – 2.45 * EAF * (KSLOC) ^ 1.09 • Time = 2.5 * (Effort) ^ 0.38 • 26.8 = 2.45 * 0.89 * 10^1.09 • 8.7 = 2.5 * 26.8 ^0.38
Cost Estimation • COCOMO II • Effort – 2.45 * EAF * (KSLOC) ^ 1.09 • Time = 2.5 * (Effort) ^ 0.38 • 26.8 = 2.45 * 0.89 * 10^1.09 • 8.7 = 2.5 * 26.8 ^0.38
Milestones • Internal Representation • Logical Representation • PPOS Tagger
Project Schedule • Presentation 1 – Oct 12, 2009 • Inception Phase • Presentation 2 – November 5, 2009 ? • Elaboration Phase • Presentation 3 – December 3, 2009 ? • Production Phase – Final Product
Phase 2 Deliverables • Vision Plan 2.0 • Project Plan 2.0 • Architectural Design Document • Software Test Plan 1.0 • Technical Inspection • Presentation 2
To Do • Revise Documents • Build GUI • Implement Internal Representation • Phase 2 Documents