Download
1 / 28
290 likes | 384 Views
Data visualization as a library service? Examples from Chalmers Library. Hi(story). William Playfair 1759 – 1823. ‘[the king] at once understood the charts and was highly pleased. He said they spoke all languages and were clear and easily understood.’ .

E N D
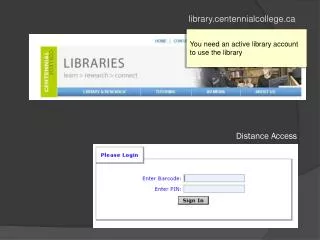
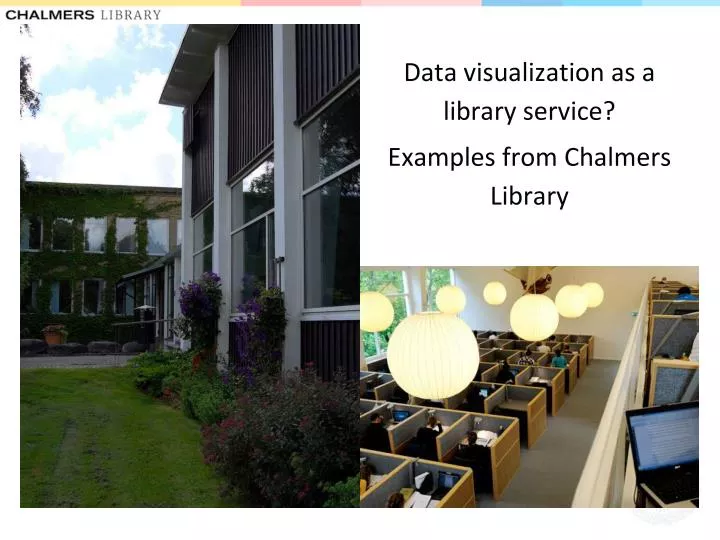
Datavisualization as a library service? • Examples from Chalmers Library
Hi(story) • William Playfair • 1759 – 1823
‘[the king] at once understood the charts and was highly pleased. He said they spoke all languages and were clear and easily understood.’
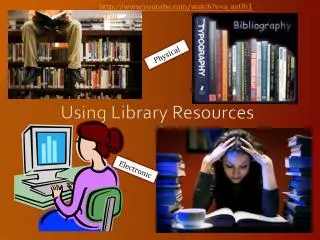
Examples: Analyzing & illustrating publishing patterns • Our repository: Chalmers Publication Library (CPL) • Network analysis - and visualisation • Authors (co-authorshipnetworks, citations networks) • Keywords (co-wordanalysis) • Organisations/departments (co-authorshipnetworks) • Geospatial visualisations • Co-authorship
Author Co-citation Analysis • Road acoustics • Top citedauthors • Links • Size • Centrality
2011-2012 ≥ 5citations 1352 journals 6clusters • “The journal cloud”
Visualizing research collaboration Publications 2012 (Chalmers/Onsala) Adress strings Data cleaning Frequency distribution ≥ 2 co-authored publications (393 organisations) Geocoding Google Maps/Google Earth W,47.506225,19.06482,"Budapest UnivTechnol & Econ, H-1111 Budapest, Hungary",,6,,
country level maps Department of Energy and Environment 2008-2013
“Gephi is an open-source software for visualizing and analyzing large networks graphs.”
“Raw is an open web app to create custom vector-based visualizations on top of the amazing D3.js library through a simple interface.”