Download
1 / 21
210 likes | 387 Views
Distributions of fission products on PCI in spent PWR fuels using EPMA. International Conference on Management of Spent Fuel from Nuclear Power Reactors Yang-Hong Jung Republic of Korea Energy Research Institute. Contents. Introduction. Sample preparation Result and discussion.

E N D
Distributions of fission products on PCI in spent PWR fuels using EPMA International Conference on Management of Spent Fuel from Nuclear Power Reactors Yang-Hong Jung Republic of Korea Energy Research Institute IAEA-CN-178/08-05
Contents • Introduction • Sample preparation • Result and discussion • Samples- 62,000 MWd/tU - at an average oxygen content region • Samples- 62,000 MWd/tU –at an oxygen rich region • Samples- 53,000 MWd/tU –failed fuel • X-ray mapping image of CRUD sampling from 62,000 MWd/tU • CRUD sampling from failed fuel using cross-section clad • Conclusions
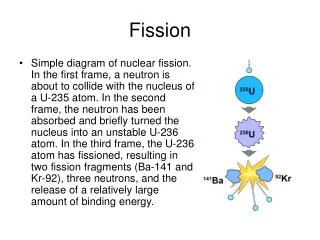
Introduction • The failed spent fuel rod with 53,000 MWd/tU and normal spent fuel rod with 62,000 MWd/tU from nuclear power plant were characterized to • compare and observe fission products in fuel-clad gap region by EPMA. • Several recent studies have been conducted on fuel rod failures involving PCI (Pellet-Clad Interaction) • The results from these studies have established that PCI failures are due to SCC(Stress Corrosion Cracking of the cladding) • So, In this study we try to identified a number of fission products (I, Cs, Cd, Xe, Kr) distribution at fuel-clad gab. • The results of this study can be used in the interim dry cask storage facilities for spent fuels which are being used in the Republic of Korea nuclear power plants. • EPMA technique offers the possibility of identifying and analyzing fission products in spent PWR fuel, although the small amounts expected to be present, and the background radiation, present a significant analytical challenge.
Experimental and Results Sample preparation • A thin diamond wheel was cut off from PWR fuel rod. • The sample have been embedded in conducting resin and polished with • diamond paste of 1 ㎛ as a final stage. • The Electron Probe Micro-Analysis(EPMA, SX-50R, CAMECA, France) • technique offers the possibility of identification and analyzing fission products. Chopping Fuel rod Mounting & Polishing Pellet removal by drilling Cladding profile with parts of pellet Schematic drawing of the sample preparation
Experimental and Results Sample preparation • The failed spent fuel rod with 53,000 MWd/tU and normal spent fuel rod with • 62,000 MWd/tU from nuclear power plant were discharged and cooled down • for 2 and 4 years, respectively. Normal spent fuel 62,000 MWd/tU Failed spent fuel 53,000 MWd/tU
Experimental and Results Samples- 62,000 MWd/tU - at an average oxygen content region • An optical microscopy and SEM image of the 62,000 MWd/tU fuel rod • at an average oxygen content region • The concentration of O, Zr, U on the marked point is illustrating the • general trend for release and redistribution in fuel-clad gap region. • The quantitative line scan data taken from across fuel-clad gab shows • stable stats at an average oxygen region. 20㎛
Experimental and Results Samples- 62,000 MWd/tU –at an oxygen rich content region • An optical microscopy, SEM and BSE image of the 62,000 MWd/tU • fuel rod at an oxygen content rich region . • Quantitative analyses of O, Zr, U on the marked point . 20㎛
Experimental and Results Samples- 62,000 MWd/tU –at an oxygen rich content region • The quantitative line scan data of O, Zr, U taken from across fuel-clad gap • shows stable states at an oxygen rich region. • The quantitative line scan data of fission products Cs, Ce, Ba, Sr, I taken from • marked point. • These results means, even at a high burn-up stat in the 62 GWd/tU, • the fuel-clad gab reliability seems to be appropriate conditions.
Experimental and Results Samples- 62,000 MWd/tU –at an oxygen rich content region • The Iodine and tellurium profiles exhibit stable states at an average oxygen • content region . • But, tellurium profiles changed dynamically increased at an rich oxygen • content region . Clad Fuel Clad Fuel
Experimental and Results Samples- 62,000 MWd/tU • The gaseous cesium and xenon distribution are not so dynamically changed • between fuel-clad gap at an average oxygen region of 62,000 MWd/tU fuel rod • Cerium and oxygen distribution are illustrating the general trend for release and • redistribution in fuel-clad gap region. Clad Fuel • Qualitative concentration profile of Cs, Xe along the clad-fuel gap O-Profile 6 ㎛ Clad Fuel • Qualitative concentration profile of Ce, O along the clad-fuel gap
Experimental and Results Samples- 62,000 MWd/tU –at an oxygen rich content region • The gaseous cesium and xenon distribution are not so dynamically changed • between fuel-clad gap at an oxygen rich region of 62,000 MWd/tU fuel rod • The qualitative concentration profile along the clad-fuel gab obtained by • EPMA to conform the reliability of fission products behaviors at high burn up • fuel conditions and compare with at an average oxygen region and higher • oxygen region. Clad Fuel • Qualitative concentration profile of Cs, Xe along the clad-fuel gap O-Profile 20 ㎛ Clad Fuel • Qualitative concentration profile of Ce, O along the clad-fuel gap
Experimental and Results Samples- 62,000 MWd/tU - at an average oxygen content region • Xenon and cesium are fission products which are release from the central • parts of the pellet • However, Xenon and oxygen concentration profiles illustrate the general trend • for release and cesium redistribution in fuel-clad gab. 20㎛ O U Xe Zr Cs Cs U I • Image mapping of Xe, Zr, O, U,Cs I on the fuel-clad gap
Experimental and Results Samples- 62,000 MWd/tU –at an oxygen rich content region • X-ray image of Xe, Zr, O, U, Cs, I • The concentration of oxygen X-ray image is quietly different from at an • average oxygen content region O 20㎛ Xe Zr Cs U I O • Image mapping of Xe, Zr, O, U, Cs, I on the fuel-clad gap
Experimental and Results-CRUD • Activated corrosion products, CRUD (Chalk River Unidentified Deposits) from BWR and PWR reactors deposit primarily on the outer surface of fuel rod. • On these surface, the deposits can lead to fuel rod failures and cladding breaches. • Also, it can become detached in cooling water and storage systems, causing additional radiation exposure to plant workers. • Zircalloy cladding is known to have a strong affinity for oxygen. • In –reactor corrosion of the cladding typically produces a thin outer layer of oxide 8-40 ㎛ in thickness. • These deposits are distinguishable from oxide corrosion products dissolved from structural material and piping which are transported into the core from the primary coolant
Experimental and Results Samples- 62,000 MWd/tU SEM, BSE, X-ray image of CRUD sampling from 6200 MWd/tU 100㎛ SE BSE 10㎛ 100㎛ 50㎛ 50㎛ 20㎛ O Fe SE BSE • Image mapping of O, Fe on the CRUD
Experimental and Results Samples- 53,000 MWd/tU –failed spent fuel CRUD sampling from failed fuel using cross-section clad 10㎛ O Zr B Quantitative Analysis points Fe C • Image mapping of Zr, B,O, Fe, C on the fuel-clad gap
Weight % Atomic % average dev average dev O 17.68 4.25 54.021 3.708 Cr 0.693 0.189 0.718 0.406 Mn 0.547 0.141 0.507 0.154 Fe 32.454 6.676 28.614 2.258 Co 0.006 0.01 0.004 0.008 Ni 18.651 1.177 16.127 2.917 Zn 0.013 0.018 0.01 0.013 Total 70.044 100 Experimental and Results Samples- 53,000 MWd/tU –failed spent fuel • EPMA quantitative analysis results were executed by dividing parts of crud • that was 8 ㎛ thick into 16 equal points • These result was similar to Trevorite (NiFe2O4) is well known of crud main • compositions. NiFe2O3.x Fe O Ni 16 point quantitative analysis on crud region
Experimental and Results Samples- 53,000 MWd/tU –failed spent fuel • X-ray image of Zr, O, U of the spent failed fuel rod with 53,000 MWd/tU • The quantitative data of fission products taken from marked point • The thickness of oxidation region was 13 ㎛ and metallic precipitates of Fe and • Sn were found. but the amounts were too low to be considered. 20㎛ O Zr O U U • Image mapping of Zr, O, U on the fuel-clad gap
Experimental and Results Samples- 53,000 MWd/tU –failed spent fuel • Distributions of fission products in PCI region. 25 beam points were set up. • Point numbers from 1-18 points were placed on cladding side. • High concentration of fission products was observed from 19-24 points • but Cs and Sr were observed over 1.0 wt %. It is almost same results of • Restani. He used SIMS and found that Sr and Cs were observed 1.2 wt% • and 1.0 wt% far from UO2 pellet by fission recoil.
Conclusions • The spent failed fuel rod with 53,000 MWd/tU and normal spent fuel rod with • 62,000 MWd/tU from nuclear power plant were characterized to compare and • observe fission products on the fuel-clad gap using EPMA. • The gaseous cesium and xenon distribution are not so dynamically changed • between fuel-clad gap at an average oxygen region of 62,000 MWd/tU fuel rod, • quantitative line scan data illustrate the general trend of release and • cesium redistribution in fuel-clad gap region. • Oxygen concentration profile at an average region is about less than 6 ㎛ • compare to 20 ㎛ at higher oxygen region between clad to fuel gap. Tellurium • profiles changed dynamically increased at an oxygen rich content region. • Oxide thickness is 13 ㎛ on the PCI region and the contents of the oxide layer • were 34 at.% of zirconium and 66.7 at.% of oxygen respectively in the failed • spent fuel rod with 53,000 MWd/tU. • The results of this study can be used in the interim dry cask storage facilities for • spent fuels which are being used in the Republic of Korea nuclear power plants.