Download

1 / 1
10 likes | 128 Views
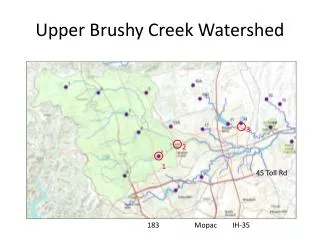
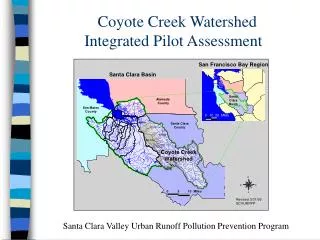
Maifan Silitonga, Ph.D., Rosner Buie, Alton B. Johnson, Ph.D. Alcorn State University. Methods Select locations within the Coles Creek watershed. Geo-reference sites using Global Positioning Systems (GPS)

E N D
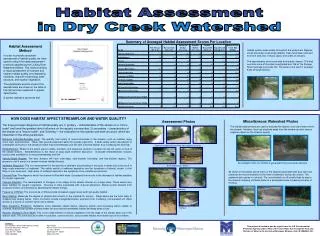
Maifan Silitonga, Ph.D., Rosner Buie, Alton B. Johnson, Ph.D. Alcorn State University • Methods • Select locations within the Coles Creek watershed. • Geo-reference sites using Global Positioning Systems (GPS) • Conduct sampling and reading of physical and chemical parameters at each site using YSI Sonde 6600 and YSI Date Reader 650 MDS. • Collect samples in sterilized bottles and store in cool compartments for testing total coliform and E. coli using Collilertsubtrates and Quanity Tray cells to estimate the presence of Total Coliform and E. coli using the Most Probable Number (MPN) method • Display land-use and site locations using ArcView/ArcGIS • Determine the correlations between land-use and water quality using Principal Component Analysis Sampling Locations Coles Creek Watershed Assessment and Education Preliminary Results Mean value of NO3- is lowest in July and highest in September (Figure 1) Mean value of E. coli is lowest in May and highest in August (Figure 1) Rainfall is highest in May, however E. coli and NO3- concentrations are not effected (Figure 1) Mean temperature for the period is not significant and may not be related to NO3- and E. coli as well (Figure 1) There is a constant increase of E. coli from May to Aug with a slight decrease in September (Figure 2) Clear evidence of high variability in NO3- and E. coli concentrations throughout the watershed (Figures 2 and 3) Figure 1. Mean Value of Rainfall, Temperature, NO3- and E. coli in the Coles Creek Watershed Summary The Coles Creek Watershed, located in the southwestern quadrant of the state of Mississippi, with an area of about 321,237 acres (1300km2). Degradation of the ponds/lakes and streams/creeks in this watershed is caused mostly by biological impairment, followed by nutrients, organic enrichment or Low Dissolved Oxygen, sediment/ siltation, pesticides, and pathogens (US EPA, 2007). Water samples are collected for physical, chemical, and biological analysis. Sampling will be conducted every month to evaluate the spatiotemporal variability of the water quality related parameters. Initial findings show high variability of NO3- and E. coli concentrations throughout the watershed. All sites exceeded the maximum contaminant level (MCL) of NO3- that is 10 mg/L and 25% of the sites do not meet the secondary standards of 235MPN/100mL for E. coli. The results will help us to better understand the phenomenon and determine the best alternative management practice(s) to be adopted and implemented by the community. Additionally, educational materials and workshops on non-point source pollution will be conducted to help increase the community’s awareness and promote environmental sustainability, thereby, having good water quality to support the economic development in the area. Objectives • To evaluate the physical, chemical, and biological parameters of water in the Coles Creek watershed and educate the community about potential sources of pollution to their water thereby promote its protection • 7. All of the sites exceeded the 10 mg/L of the allowable NO3- Maximum Contaminant Level • NO3- concentration in September shows the highest peak followed by the month of May • E. coli concentrations shows high variability throughout the watershed without showing specific trend • All sampling locations have E. coli present with 25% of the sites do not meet the secondary standards of 235 MPN/100 mL • Additional information and data will be needed for further analysis Figure 2. NO3- Concentrations (mg/L) in the Coles Creek Watershed Workshops As part of the effort to educate the public about non-point source pollution and water resource protection, several workshops were conducted: • Storm water drainage protection • Non-point source pollution education • Recycling event Non-Point Source Education Stormwater Protection Figure 3. E. coli (MPN) Distributions in the Coles Creek Watershed Recycling Collection