Download
1 / 5
50 likes | 184 Views
Image 1.1. Soil Hydraulic Properties Report at 21 Acres. A. B. C. I. F. D. H. J. E. G. K. Caitlin Campbell, Julie Thomas and Aaron Witty. Image courtesy of Google Maps. Figure 1.3 Porosity.

E N D
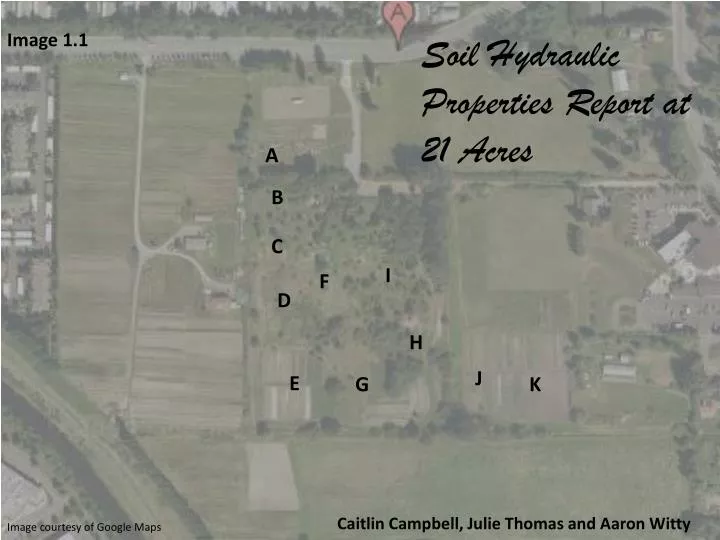
Image 1.1 Soil Hydraulic Properties Report at 21 Acres A B C I F D H J E G K Caitlin Campbell, Julie Thomas and Aaron Witty Image courtesy of Google Maps
Figure 1.3 Porosity • As shown in Figure 1.1, porosity of the soils in 21 Acres ranges from 53-76% with a mean of 66.54% porosity. Please refer to Image 1.1 for approximate locations. • Figure 1.1- Porosity data from soil collected at 21 Acres. On February 4, 2010, students with different science backgrounds collected data and results vary depending on dates soil was tested and processed. Some data was not received or may be inaccurate.
Figure 1.4 Field Capacity • As shown in figure 1.2, the field capacity of the soils collected from 21 Acres varied immensely. The field capacity ranged from 16-85% with a mean of 34.85% field capacity. Please refer to Image 1.1 for approximate locations. • Figure 1.2- Field capacity from soil collected at 21 Acres. On February 4, 2010, students with different science backgrounds collected data and results vary depending on dates soil was tested and processed. Some data was not received or may be inaccurate.
Figure 1.5 Average Organic Matter • As shown in figure 1.5, the average organic matter of the soils collected from 21 Acres varied immensely. The organic matter ranged from 0-57% with a mean of 10.66% organic matter. Please refer to Image 1.1 for approximate locations. • Figure 1.5- Average organic matter from the soil collected at 21 Acres. On February 4, 2010, students with different science backgrounds collected data and results vary depending on dates soils were tested and processed. Some data was not received or may be inaccurate.
Figure 1.6 Saturation • As shown in figure 1.6, the saturation percent of the soils collected from 21 Acres varied immensely. The saturation percents ranged from 0-75.5% with a mean of 20% saturation. Please refer to Image 1.1 for approximate locations. • Figure 1.6-saturation percents from the soil collected at 21 Acres. On February 4, 2010, students with different science backgrounds collected data and results vary depending on dates soil was tested processed. Some data was not received or may be inaccurate.