Download
1 / 32
320 likes | 342 Views
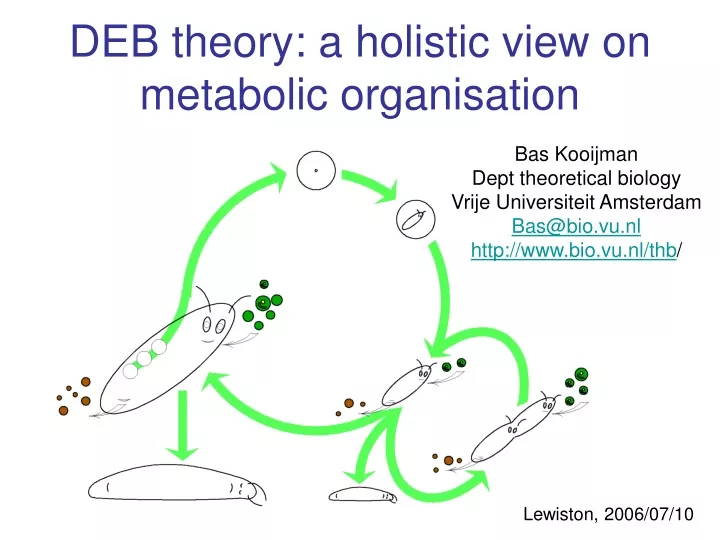
DEB theory: a holistic view on metabolic organisation. Bas Kooijman Dept theoretical biology Vrije Universiteit Amsterdam Bas@bio.vu.nl http://www.bio.vu.nl/thb /. Lewiston, 2006/07/10. Contents. introduction surface-volume interactions homeostasis & metabolism evolution & symbiosis

E N D
DEB theory: a holistic view on metabolic organisation Bas Kooijman Dept theoretical biology Vrije Universiteit Amsterdam Bas@bio.vu.nl http://www.bio.vu.nl/thb/ Lewiston, 2006/07/10
Contents • introduction • surface-volume interactions • homeostasis & metabolism • evolution & symbiosis • growth • body size scaling • producer-consumer dynamics Lewiston, 2006/07/10
Dynamic Energy Budget theoryfor metabolic organisation • Uptake of substrates (nutrients, light, food) • by organisms and the use of these substrates • (maintenance, growth, development, reproduction) • First principles, quantitative, axiomatic set up • Aim: Biological equivalent of Theoretical Physics • Primary target: the individual with consequences for • sub-organismal organization • supra-organismal organization • Relationships between levels of organisation • Many popular empirical models are special cases of DEB
Space-time scales Each process has its characteristic domain of space-time scales system earth space ecosystem population When changing the space-time scale, new processes will become important other will become less important Individuals are special because of straightforward energy/mass balances individual cell time molecule
DEB theory is axiomatic, based on mechanisms not meant to glue empirical models Since many empirical models turn out to be special cases of DEB theory the data behind these models support DEB theory This makes DEB theory very well tested against data Empirical special cases of DEB
Some DEB pillars • life cycle perspective of individual as primary target • embryo, juvenile, adult (levels in metabolic organization) • life as coupled chemical transformations (reserve & structure) • time, energy, entropy & mass balances • surface area/ volume relationships (spatial structure & transport) • homeostasis (stoichiometric constraints via Synthesizing Units) • implied co-variation of parameter values: body size scaling • loosely coupled metabolic modules (supply-demand spectrum) • syntrophy (basis for symbioses, evolutionary perspective)
Change in body shape Isomorph: surface area volume2/3 volumetric length = volume1/3 Mucor Ceratium Merismopedia V0-morph: surface area volume0 V1-morph: surface area volume1
Mixtures of V0 & V1 morphs growing in length only; = aspect ratio volume, m3 hyphal length, mm Bacillus = 0.2 Collins & Richmond 1962 Fusarium = 0 Trinci 1990 time, min time, h volume, m3 volume, m3 Escherichia = 0.28 Kubitschek 1990 Streptococcus = 0.6 Mitchison 1961 time, min time, min
Mixtures of changes in shape Dynamic mixtures between morphs V1- V0-morph outer annulus behaves as a V1-morph, inner part as a V0-morph. Result: diameter increases time Lichen Rhizocarpon V1- iso- V0-morph
Homeostasis Homeostasis: constant body composition in varying environments Strong homeostasis generalized compounds applies to reserve(s) and structure(s) separately Weak homeostasis: ratio reserve/structure becomes and remains constant if food or substrate is constant (while the individual is growing) applies to juvenile and adult stages, not to embryos Structural homeostasis: suborganismal structures have a constant relative size
Biomass: reserve(s) + structure(s) • Reserve(s), structure(s): generalized compounds, • mixtures of proteins, lipids, carbohydrates: fixed composition • Compounds in • reserve(s): equal turnover times, no maintenance costs • structure: unequal turnover times, maintenance costs • Reasons to delineate reserve, distinct from structure • metabolic memory • explanation of respiration patterns (freshly laid eggs don’t respire) • biomass composition depends on growth rate • fluxes are linear sums of assimilation, dissipation and growth • basis of method of indirect calorimetry • explanation of inter-species body size scaling relationships
Biomass composition Data Esener et al 1982, 1983; Kleibsiella on glycerol at 35°C nHW Entropy J/C-mol.K Glycerol 69.7 Reserve 74.9 Structure 52.0 Sousa et al 2004 submitted Relative abundance nOW O2 nNW Weight yield, mol.mol-1 Spec prod, mol.mol-1.h-1 Spec growth rate, h-1 CO2 Spec growth rate kE 2.11 h-1 kM 0.021 h-1 yEV 1.135 yXE 1.490 rm 1.05 h-1 g = 1 nHE 1.66 nOE 0.422 nNE 0.312 nHV 1.64 nOV 0.379 nNV 0.189 Spec growth rate, h-1
Yield vs growth Streptococcus bovis, Russell & Baldwin (1979) Marr-Pirt (maintenance, no reserve) DEB (maintenance & reserve) 1/yield, mmol glucose/ mg cells spec growth rate yield 1/spec growth rate, h Russell & Cook (1995): this is evidence for down-regulation of maintenance at high growth rates DEB theory: high reserve density gives high growth rates structure requires maintenance, reserves do not Kooijman & Troost 2006 Biol Rev, to appear
Interactions of substrates • Synthesizing Units (SUs): • generalized enzymes • that follow the rules of • classic enzyme kinetics • but • working depends on • fluxes of substrates, • rather than concentrations • backward fluxes are small in • S + E SE EP E + P Kooijman, 2001 Phil Trans R Soc B 356: 331-349
Simultaneous nutrient limitation specific growth rate, d-1 70 7 vitamine B12 1021 mol cell-1 0 P-content, fmol cell-1 Pavlova lutheri, 20 ºC Data from Droop 1974 absence of high contents for both compounds due to damming up of reserves, low contents in structure (at zero growth) Kooijman 1996 Biophys Chem 73: 179-188
Evolution of DEB systems strong homeostasis for structure variable structure composition delay of use of internal substrates increase of maintenance costs 3 4 5 1 2 5 6 7 8 strong homeostasis for reserve reproduction juvenile embryo + adult inernalization of maintenance installation of maturation program Kooijman & Troost 2006 Biol Rev, to appear
Symbiosis substrate product
Symbiosis substrate substrate
Steps in symbiogenesis 3 2 4 1 Free-living, homogeneous Free-living, clustering Internalization 4 5 Structures merge Reserves merge Kooijman et al 2003 Biol Rev 78: 435-463
Product Formation DEB theory: Product formation rate = wA. Assimilation rate + wM. Maintenance rate + wG . Growth rate For pyruvate: wG<0 ethanol pyruvate, mg/l pyruvate glycerol, ethanol, g/l glycerol Leudeking & Piret (1959): Product formation rate = wM . Maintenance rate + wG . Growth rate Cannot explain observed pattern throughput rate, h-1 Glucose-limited growth of Saccharomyces Data from Schatzmann, 1975
Embryonic development Crocodylus johnstoni Data from Whitehead 1987 embryo yolk O2 consumption, ml/h weight, g time, d time, d ; : scaled time l : scaled length e: scaled reserve density g: energy investment ratio Zonneveld & Kooijman 1993 Bull Math Biol 3:609-635
Not age, but size: :These gouramis are from the same nest, they have the same age and lived in the same tankSocial interaction during feeding caused the huge size differenceAge-based models for growth are bound to fail; growth depends on food intake Trichopsis vittatus
Rules for feeding • Constant number of food particles at random positions • Individuals travel in straight lines to nearest food particle • Speed, handling time, growth follow standard DEB rules • Food particles are not “visible” if too close to other individuals • distance squared ratio of body lengths
Social interaction Feeding determin expectation length reserve density 1 ind time time 2 ind length reserve density time time
Primary scaling relationships assimilation {JEAm} max surface-specific assim rate Lm feeding {b} surface- specific searching rate digestion yEX yield of reserve on food growth yVEyield of structure on reserve mobilization v energy conductance heating,osmosis {JET} surface-specific somatic maint. costs turnover,activity [JEM] volume-specific somatic maint. costs regulation,defence [JEJ] volume-specific maturity maint. costs allocation partitioning fraction egg formation R reproduction efficiency life cycle [EJb] volume-specific maturity at birth life cycle [EJp] volume-specific maturity at puberty aging ha aging acceleration Kooijman 1986 J. Theor. Biol. 121: 269-282 maximum length Lm = {JEAm} / [JEM]
Scaling of metabolic rate Respiration: contributions from growth and maintenance Weight: contributions from structure and reserve Structure ; = length; endotherms Kooijman et al 2006 Sar & Qsar, to appear
Metabolic rate slope = 1 Log metabolic rate, w O2 consumption, l/h 2 curves fitted: endotherms 0.0226 L2 + 0.0185 L3 0.0516 L2.44 ectotherms slope = 2/3 unicellulars Log weight, g Length, cm Intra-species Inter-species Data: Hammingsen, 1969 Daphnia pulex; Data: Richman, 1958
Feeding rate slope = 1 Filtration rate, l/h Mytilus edulis Data: Winter 1973 poikilothermic tetrapods Data: Farlow 1976 Length, cm Inter-species: JXm V Intra-species: JXm V2/3
Von Bertalanffy growth rate 25 °C TA = 7 kK 10log von Bert growth rate, a-1 10log ultimate length, mm 10log ultimate length, mm At 25 °C : maint rate coeff kM = 400 a-1 energy conductance v = 0.3 m a-1 ↑ ↑ 0
Producer/consumer dynamics closed for nutrient; consumer requires producer’s structure & reserve 20 3.0 1.0 Bifurcation diagram consumers homoclinic tangent Hopf focus 10 1.15 2.7 0 1.53 2.8 1.23 0 1.23 2 4 6 8 2.5 nutrient producers consumers 2.4 1.75 2.3 isoclines Theor Pop Biol tp appear
Food chains n=2 glucose mg/ml Escherichia coli mm3/ml h = 0.064 h-1, Xr = 1mg ml-1, 25 °C cell vol, m3 Data from Dent et al 1976 Dictyostelium mm3/ml cell vol, m3 Kooijman & Kooi,1996 Nonlin. World3: 77 - 83 time, h time, h
DEB tele course 2007 Cambridge Univ Press 2000 http://www.bio.vu.nl/thb/deb/ Free of financial costs; some 200 h effort investment Feb-April 2007; target audience: PhD students We encourage participation in groups that organize local meetings weekly French group of participants of the DEB tele course 2005: special issue of J. Sea Res. 2006 on DEB applications to bivalves Software package DEBtool for Octave/ Matlab freely downloadable Slides of this presentation are downloadable from http://www.bio.vu.nl/thb/users/bas/lectures/ Audience: thank you for your attention Organizers: thank you for the invitation