Download
1 / 73
730 likes | 738 Views
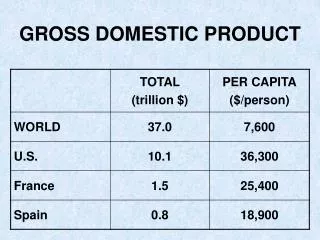
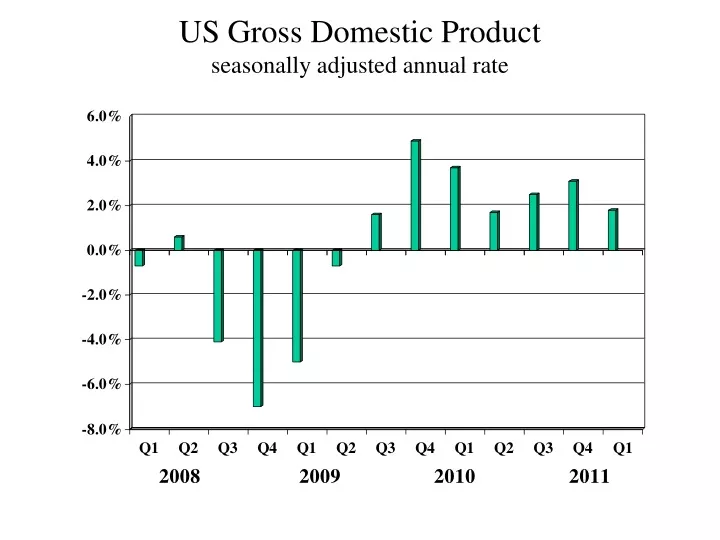
US Gross Domestic Product seasonally adjusted annual rate. Consumption seasonally adjusted annual rate. Investment Spending seasonally adjusted annual rate. Foreign Trade seasonally adjusted annual rate. Inventory Investment billions of 2005 dollars seasonally adjusted annual rates.

E N D
Inventory Investmentbillions of 2005 dollarsseasonally adjusted annual rates
Nonfinancial Corp: Profits After Taxbillions dollars, seasonally adjusted annual rates
Retail Sales: Furniture Storesmillions of dollars, seasonally adjusted
Retail Sales: Electronic/Appliance Storesmillions of dollars, seasonally adjusted
Retail Sales: Building Material/Garden Supply Storesmillions of dollars, seasonally adjusted
Retail Sales: General Merchandise Storesmillions dollars, seasonally adjusted
Retail Sales: Food/Beverage Storesmillions of dollars, seasonally adjusted
Retail Sales: Nonstore Retailersmillions of dollars, seasonally adjusted
Retail Sales: Food Services & Drinking Pacesmillions of dollars, seasonally adjusted
Retail Sales: Misc. Retail Outletsmillions of dollars, seasonally adjusted
Final Sales to Domestic Purchasers(seasonally adjusted annual rates)
Demand for Freight Transportation ServicesIndex 2000 = 100.0Source: Bureau of Transportation Statistics
Corporate Profits: Retailersseasonally adjusted annual ratesbillions of dollars
Corporate Profits: Wholesalersseasonally adjusted annual ratesbillions of dollars
Corporate Profits: Chemical Producersseasonally adjusted annual ratesbillions of dollars
Corporate Profits: Petroleum & Coal Producersseasonally adjusted annual ratesbillions of dollars
Production of Cement and Concrete ProductsIndex 2007 = 100.0
Housing Startsthousands of unitsseasonally adjusted annual rates
Employment: Wholesale and Retail Trades IndustriesIndex 1997 = 1.00
Non-Manufacturing Business ActivityIndex 50+: ExpansionSource: Institute for Supply Management
State and Local GovernmentSurplus (+)/Deficit (-)current dollars, seasonally adjusted annual rates
State/Local Governments Investment Spending on Equipment/Softwarebillions 2005 dollars, saar
Price of a Gallon of Diesel FuelCents Per GallonSource: Energy Information Administration
U.S. Retail Price Gasolinecents per gallonSource: Energy Information Administration
Producer Price Index - Class 8 Truck/TractorIndex June 1987 = 100.0