Download
1 / 11
110 likes | 196 Views
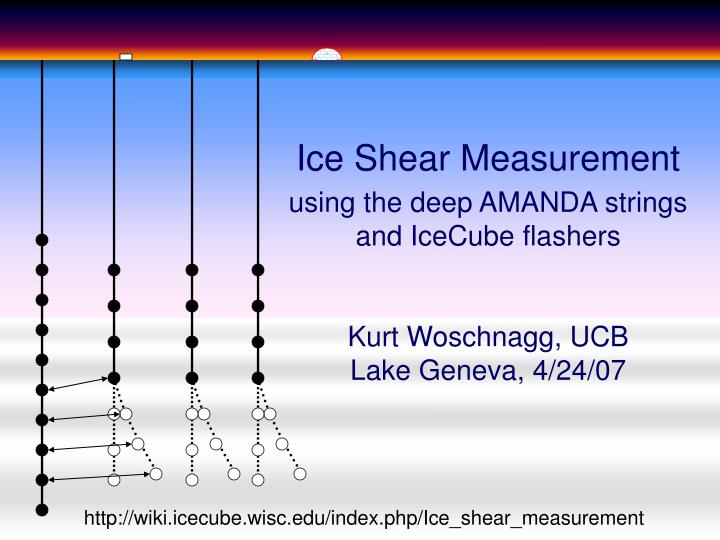
Ice Shear Measurement using the deep AMANDA strings and IceCube flashers Kurt Woschnagg, UCB Lake Geneva, 4/24/07. http://wiki.icecube.wisc.edu/index.php/Ice_shear_measurement. Note: flow is really 10 m at surface. Ice temperature profile from AMANDA thermistors. Fill in IceCube

E N D
Ice Shear Measurement using the deep AMANDA strings and IceCube flashers Kurt Woschnagg, UCB Lake Geneva, 4/24/07 http://wiki.icecube.wisc.edu/index.php/Ice_shear_measurement
Note: flow is really 10 m at surface Ice temperature profile from AMANDA thermistors Fill in IceCube data (5 strings) shear model AMANDA strings 11-13: ► extend to 2350 m ► deployed Jan 1998 × 9 years
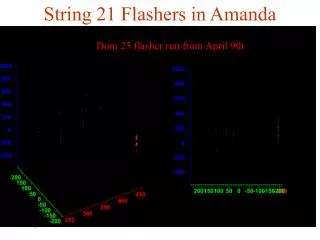
IceCube strings 48/57/58: ► Surround 11/12/13 ► Newly deployed → (~)vertical ► All DOMs have working flashers → measure individual DOM-OM distances vs depth
√ √ √ T0-less analysis through triangulation (x2,y2) (x1,y1) d1 d2 flashing (x,y) receiving d3 (x3,y3) T d1 = (x1-x)2 + (y1-y)2 = v(T1 - t0) d2 = (x2-x)2 + (y2-y)2 = v(T2 - t0) d3 = (x3-x)2 + (y3-y)2 = v(T3 - t0) time [ns] flash time prompt time Known: x1, y1, x2, y2, x3, y3, v Unknown: x, y, t0
Analysis Strategy 1. Merge TWR events with TestDAQ data (flasher pulse) 2. Assume reasonable T0 start values for AMANDA OMs 3. Make travel time histograms for all receivers 4. Fit leading edges (=prompt times+scattering) and convert to distances (may require ice simulations) 5. Triangulate: solve 3 equations for receiver OM's (x,y,T0) 6. Plot fitted (x,y) vs depth → is there a trend? → is it along the flow direction? → at least upper limit on ice shear Note: this measurement can possibly also be done with muon tomography [Martino Olivo/Carsten Rott]
Requirements • Flashers on 48, 57, 58 operational (only with TestDAQ for now) • TWRdaq operational • Deep OMs alive • Deep OMs read out by TWR (6 electrical, 18 optical) • IceCube/TWR time synch to a few ns • IceCube/TWR data merging fusing should work (Steve M., Gustav W.)
Will AMANDA trigger? well…
How vertical were strings 11-13 in 1998? 11 12 [Analysis and plots by Varun Gopalakrishna (UW)]
Run Plan • Pilot runs • Determine suitable brightness • Provide data to develop analysis code • flash DOMs 33 and 48 on 48/57/58 • two different intensities per flasher • 10 min/run → 2 hours • Data runs • flash every DOM 40-54 on 48/57/58 • flash a few DOMs 20-30 on 48/57/58 • each run 5-10 min → 5-10 hours
Status • Pilot runs delayed by AMANDA illness • Fixed now • Pilot runs to be taken soon • Want to get data taking out of the way before physics runs start