Download
1 / 52
720 likes | 1.63k Views
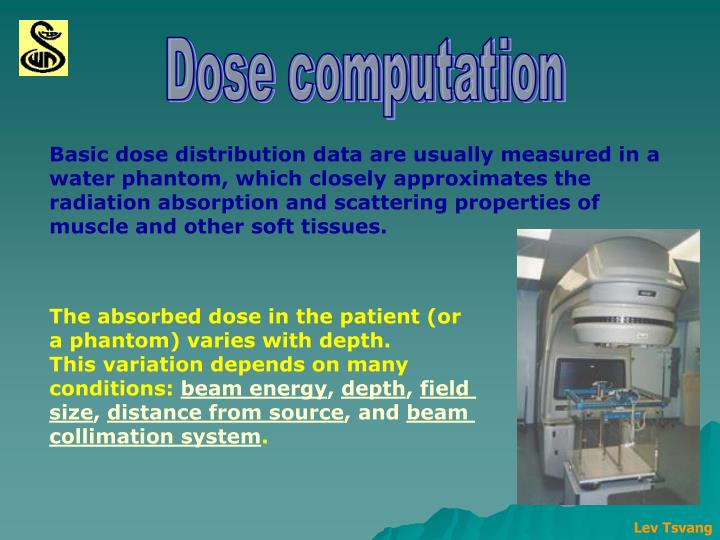
Dose computation. Basic dose distribution data are usually measured in a water phantom, which closely approximates the radiation absorption and scattering properties of muscle and other soft tissues. The absorbed dose in the patient (or a phantom) varies with depth.

E N D
Dose computation Basic dose distribution data are usually measured in a water phantom, which closely approximates the radiation absorption and scattering properties of muscle and other soft tissues. The absorbed dose in the patient (or a phantom) varies with depth. This variation depends on many conditions: beam energy, depth, field size, distance from source, and beam collimation system. Lev Tsvang
Dose computation An essential step in the dose calculation system is to establish depth dose variation along the central axis of the beam. Lev Tsvang
Dose computation The region between the surface and the point of maximum dose is called the dose build-up region. The dose build-up effectof the high energy beams gives rise to what is clinically known asthe skin-sparing effect. Build-up Region Lev Tsvang
Dose computation The dose to a point in a medium may be analyzed into primary and scattered component. The primary dose is contributed by the initial or original photons emitted from the source. The scattered dose is the result of the scattered photons. - The scattered dose can be analyzed into collimator Sc and phantom Spcomponents. Lev Tsvang
Dose computation If we can to use a dose distribution data from a water phantom measurement forward for a planning of patient treatment ? Lev Tsvang
Dose computation A number of quantities have been defined for this purpose (dose computation), major among these being: - percentage depth dose (PDD); SSD techniiques - tissue-air ratio (TAR); SADtechniiques - scatter-air ratio (SAR); - tissue-phantom ratio (TPR); - tissue-maximum ratio (TMR); Lev Tsvang
Dose computation Percentage depth dose (PDD) PDDmay be defined as the quotient, expressed as apercentage, of the absorbed dose at any depth d(Dd) to the absorbed dose at a fixed reference depth do(Ddo), along thecentral axis of the beam. Dd _____ x P = 100 d Dd o o - reference depth of maximum dose Collimator d - any depth Central axis d o Surface of phantom x D d In clinical practice, the peak absorbed dose on the central axis is sometimes calledthe maximum dose,the dose maximum,the given dose,or simplyDmax. d o x D d Lev Tsvang
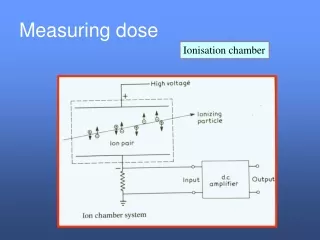
Dose computation Tissue-air ratio (TAR) S S Phantom Equilibrium Mass Dd ___ r TAR(d,rd)= d r d d Dfs * * d - depth D d D f.s. r d - field size Tissue-air ratio may be defined as the ratio of the dose (Dd) at a given point in the phantom to the dose in free space (Dfs) at the same point. Lev Tsvang
Dose computation Scatter – air ratio (SAR) SAR may be defined as the ratio of the scattered dose at a given point in the phantom to the dose in free space at the same point. SAR(d, rd) = TAR(d, rd) – TAR(d, 0) Dose calculation in irregular fields –Clarkson’s method use SAR to calculate the scattered dose. Lev Tsvang
Dose computation Tissue-phantom ratio (TPR) Tissue-phantom ratio may be defined as the ratio ofthe dose (Dd) at a given point in the phantomtothe dose (Dto)at the same point at a fixed reference depth, usually 5 cm. S S Phantom Phantom d to * * rd Dd rd D to Dd TPR(d,rd)= _____ D to to - reference depth Lev Tsvang
Dose computation Tissue-maximum ratio (TMR) S S Phantom Phantom d to * * rd Dd rd D to If to is the reference depth of maximum dose (to = dmax), then: TPR = TMR Lev Tsvang
Basic algorithms Several methods are available for calculating absorbed dose in a patient: The methods are using a simulator data for calculating absorbed dose in a patient. The methods are using a CT- scans for calculating absorbed dose in a patient. Lev Tsvang
Basic algorithms The methods are using a simulator data for calculating absorbed dose in a patient. The Clarkson’s method are used for dose calculating in irregular fields. It is based on the principle that scattered component of the depth dose, which depends on the field size and shape, can be calculated separately from the primary component which is independent of the field size and shape. The dose calculating in open and asymetrical fields are based on the using TAR, SAR, TPR, TMR and SMR methods. open field asymetric field irregular field Lev Tsvang
Basic algorithms The methods are using a simulator data for calculating absorbed dose in a patient. open field irregular field A computer algorithms embodying the Clarkson’s principle and SAR (SMR) were developed by Cunningham et al.at the Princess Margaret Hospital (Toronto) and by Khan at the University of Minesota. The following data are provided for particular patient: asymetric field 1.Contur points: the outline of the irregular field can be drawn from the port film with actual blocks. 2.The coordinates (x,y) of the pointsof calculation are also entered, including the reference point, usually on the central axis. 3.Patient measurements: patient thickness, SSDs, and source-to-film distance at various points of interest. Lev Tsvang
Basic algorithms The methods are using a CT- scans for calculating absorbed dose in a patient. Dose calculations algorithms for computerized treatment planning fall into three categories: 1. correction-based; 2. model-based; 3. direct Monte-Carlo 1. Correction-based algorithmsare semi-empirical. They are based primarily on measured data (PDD, cross-beam profiles, etc.) obtained in cubic water phantom. Various corrections in the form analytic functions or factors are applied to calculate dose distributions in the patient. Tipically corrections: - attenuation corrections for contour irregularity; - scatter corrections as a function of scattering volume, field size, shape and radial distance; Lev Tsvang
Basic algorithms The methods are using a CT- scans for calculating absorbed dose in a patient. Correction-based algorithms (continue) Typically corrections: - geometric corrections for source to point of calculation distance based on the inverse square law; 1 R2 - attenuation corrections for beam intensity modifiers such as wedge filters, compensators, blocks, etc.; - attenuation corrections for tissue heterogeneities based on radiologic path length (unit-density equivalent depth). Lev Tsvang
Basic algorithms The methods are using a CT- scans for calculating absorbed dose in a patient. 2. A model-based algorithmcomputes dose distribution with a physical model that simulates the actual radiation transport. Because of its ability to model primary photon energy fluence incident at a point and the distribution of energy subsequent to primary photon interaction, it is able to simulate the transport of scattered photon and electrons away from interaction site. r’ r Primary interaction site P A class of model-based algorithms is called a convolution-superposition method r – r’ P is the Dose deposition site Lev Tsvang
Basic algorithms The methods are using a CT- scans for calculating absorbed dose in a patient. 3. Direct Monte-Carlo The Monte-Carlo techmique consists of a computer program (MC code) that simulates the transport of millions of photons and particles throuch matter. It uses fundamental laws of physics to determine probability distributions of individual interactions of photons and particles. A number of MC codes has been used in radiation transport simulation and in treatment planning:Electron Gamma Shower version 4 (EGS4),ETRAN/ITS,Monte-Carlo N-particle(MCNP),PENELOPEandPEREGRINE. Lev Tsvang
Construction of isodose distributions The lines passing through points of equal dose are called the isodose curves. The curves are usually drawn at regular intervals of absorbed dose and expressed as a percentage of the dose at a reference point. Lev Tsvang
Construction of isodose distributions Isodoses chart can be measured by means of ion chambers, solid state detectors or radiographic films. Parameters of isodose curves The parameters that affect the single-beam isodose arebeam quality (energy and sort radiation), source size, beam collimation, field size, SSD and the source-to-diaphragm distance(SDD). Lev Tsvang
Construction of isodose distributions Beam quality - The depth of a given isodose curve increases with beam energy. - Beam energy influences isodose curve near the field borders. - The absorbed dose in the medium outside the primary beam is greater for low-energy beams than for those of higher energy (because latteral scatter). - Physical penumbra depends on beam energy and then the isodose curves outside the primary beam are greatly distended in the case low-energy radiation. Lev Tsvang
Construction of isodose distributions Source size,SSD andSDD - Source size, SSD and SDD affect the shape of isodose curves by virtue of the geometric penumbra. - In addition, the SSD affects the PDD and therefore the depth of the isodose curves. Field size Field size is one the most important parameters in treatment planning. Adequate dosimetric coverage of the tumor requires a determination of appropriate field size. This determination must always be madedosimetricallyrather thangeometrically. A certain isodose curve(e.g. 90%) enclosing the treatment volume should be the guide in choosing a field size rather than the geometric dimensions of the field. Lev Tsvang
Construction of isodose distributions Collimation and flattering filter - The term collimation is used to designate the collimators blocks that give shape and size to the beam and the flattering filter and other absorbers or scatters in the beam between the target and patient. - These parameters determine the shape of the isodose curves. Lev Tsvang
Monitor unit calculations Treatment machines are usually calibrated to deliver1 rad(1 cGy)per monitor unit(MU) at the reference depthto, for a reference fieldsize10 x 10 cmand a source-to-calibrationpoint distance ofSCD. SSD technique TD x 100 _________________________________________________ MU = K x (%DD)dx Sc(rc) x Sp(r) x (SSD factor) SAD ____ K is 1 rad per MU rc = r x SCD SSD factor = ( _______ )2 SSD SSD + to rcis collimator field size Sc– factor relate to collimator field size defined at the SAD Sp– factor relates to field irradiating the patient TD is a tumor dose at depth d for a field size r at the surface at any SSD Lev Tsvang
Monitor unit calculations Isocentric technique The monitor units necessary to deliver isocenter dose (ID) at the depth d are given by ID ___________________________________________________ MU = K x TMR(d,rd) x Sc(rc) x Sp(rd) x (SAD factor) SCD SAD factor = ( _____ )2 SAD Cobalt-60 calculations (TD x 100) ___________________________________________________ Time = Do(do,ro,fo) x %DD(d,r,f) x Scx Spx SSD factor Do(do,ro,fo) is dose rate in phantom at depth to of maximum dose for a reference field size ro and standard SSD fo Lev Tsvang
Monitor unit calculations SSD and SAD techniques Lev Tsvang
Monitor unit calculations Stationary and rotational techniques Stationary technique Rotational technique Lev Tsvang
Monitor unit calculations Isocentric technique d d SSD = 100 cm, d = 0.5 thickness SAD SSD = 100 - d cm, d = 0.5 thickness Lev Tsvang
Monitor unit calculations Electron beam Photon beam 15% isodose 15% isodose Electron beam, field size 15 x 15 cm Photon beam, field size 15 x 15 cm Energy – 15 MeV, SSD = 100 cm Energy – 6 MV, SSD = 100 cm Lev Tsvang
Dose calculation Single field S Given dose = maximum dose - Dmax Sample Dose for patient is 200 cGy on the depth 10 cm. Field size is 15 x 10 cm. on the depth 10 cm. Energy is 15 MV. MU calculated for a open field by using: Exitdose Simulator data CT-scan data SAD technique 224 MU 227 MU SSD technique 274 MU 278 MU Lev Tsvang
Dose calculation Parallel opposed fields S S Same patient data SAD SSD d d MU calculated for a open field bu using: S 112 MU 137 MU Simulator data 112 MU 137 MU CT-scan data S Lev Tsvang
Dose calculation It is possible to calculate depth dose distribution at any point within the field or outside the field using Clarkson’s technique. 2a 2a 2d Point of- axis a d 2b b Q 2c 2c 2d P c 2b Central axis To calculate dose at any point Q, the field is imagined to be divided into four sections and their contribution is computed separately. Thus the dose at depth d along the axis through Q is given by ¼ (sum of central axis dose at depth d for 4 fields). Lev Tsvang
Dose calculation Point outside the field Point under the block a c a a c c a Q Q 2a b b P P Central axis DQ=0.5x(DQ (fld (2a+2c)xb)) – DQ (fld(2cxb)) DQ= (DQ (fld (2a+c)x2a)) – DQ (fld(cx2a))x(1-T) Lev Tsvang
ICRU Report 50 Internatonal Comission on Radiation Units and Measurements 1. Quantities and units of radiation and radioactivity 2. Procedures suitable for the measurement and application of these quantities in clinical radiology and radiobiology 3. Physical data needed in the application of these procedures, the use of which tends to assure uniformity in reporting Lev Tsvang
ICRU Report 50 ICRU Report 50, 1993 (ICRU Report 62, 1999) Prescribing, Recording, and Reporting Photon Beam Therapy Report 50 contained recommendations on how to report a treatment in external photon beam therapy. These recommendations were formulated in such a way that they can generally be followed in all centers worldwide. - Volumes and Margins - Organs at Risk - Conformity Index - Dose Specification for Reporting Lev Tsvang
ICRU Report 50 Volumes and Margins a) Reference Points Alignment of the patient in a reproducible and stable position is a prerequisite for correct definition of volumes and set-up of beams. Internal Reference Pointare anatomical landmarks (e.g., bony structures or gas- filled cavity) which may be used for localization of theGTVandCTVand for accurate set-up at the imaging unit (simulator or treatment unit). External Reference Pointare palpable or visible point located on or near the surface of the body or on the surface of immobilization devices that fit closely to the exterior of the body. Lev Tsvang
ICRU Report 50 Volumes and Margins b) Coordinate Systems Three types of coordinate systems are involved in the planning and execution of radiation treatments. Coordinate System Related to Patient. The reference coordinate system for the patient is based on either internal or external reference points. Z Y Coordinate System Related to Imaging and Treatment Units. These coordinate systems are defined with respect to the gantry, collimators, radiation beam, light beams, laser alignment beams and couch-top system. X Lev Tsvang
ICRU Report 50 Volumes and Margins c) Volumes - Gross Tumor Volume(GTV); - Clinical Target Volume(CTV); - Planning Target Volume(PTV); - Treated Volume ; - Irradiate Volume ; Lev Tsvang
ICRU Report 50 Volumes and Margins c) Volumes Gross Tumor Volume (GTV) The Gross Tumor Volumeis the gross demonstrable extent and location of the malignant growth. The GTV consists of primary tumor ( “GTV primary”) and possibly metastatic limphadenopathy ( “GTV nodal”) or other metastases ( “GTV M”). It may not be possible to define aGTVafter surgical intervention. Lev Tsvang
ICRU Report 50 Volumes and Margins c) Volumes Clinical Target Volume(CTV) The Clinical Target Volumeis a tissue volume that contains a demonstrable GTV and/or sub-clinical malignant disease that must be eliminated. This volume must be treated adequately in order to achieve the aim of radical therapy. TheCTVis , like theGTV, a purely clinical-anatomical concept and can be described as including structures with clinically suspected but unproved involvement, in addition to any known tumor (hence “sub-clinical disease). Lev Tsvang
ICRU Report 50 Volumes and Margins c) Volumes Planning Target Volume(PTV) The Planning Target Volume is a geometrical concept used for treatment planning, and it is defined to select appropriate beam sizes and beam arrangements, to ensure that the prescribed dose is actually delivered to the CTV. The Planning Target Volume is theCTVplus a margins which includes a variations in tissue position, size and shape, as well as a variations in patient position and beam position, both intra-fractionally and inter-fractionally. ICRU Report 62 adds a new definitions: - Internal Margin (IM) which includes an internal physiological movements and variation in size, shape and position of the CTV; Lev Tsvang
ICRU Report 50 Volumes and Margins c) Volumes Planning Target Volume(PTV) - Set-up Margin (SM) which includes a patient movement and set-uo uncertainties. As a result of a new definitions was defined a new volume which includesCTVwithIM: - Internal Target Volume (ITV). New definition ofPlanning Target Volumeis the volume that includes CTV with IM and SM. The definition of a margin can either account for all potential variations and uncertainties or include only a certain proportion (e.g., 2 standard deviations). Lev Tsvang
ICRU Report 50 Volumes and Margins c) Volumes Treated Volume The Treated Volume is the tissue volume that is planned to receive at least a dose selected and specified by the radiation oncology team as being appropriate to achieve the purpose of the treatment. The Treated Volume is enclosed by95%of the prescription dose isodose surface. Irradiate Volume The Irradiate Volume is the tissue volume that receives a dose that is considered significant in relation to normal tissue tolerance. Volume ratio Beam arrangement PTV Treated Irradiate (359 cm3) volume volume Open beams: Two Parallel Opposed Beams 1 4.35 8.56 Three Intersecting Beams 1 2.61 11.90 Four Intersecting Beam 1 2.61 9.58 Arc Therapy 1 2.18 9.14 Lev Tsvang
ICRU Report 50 Organs at Risk Organs at Risk (OR) Organs at Risk (“critical normal structures”) are normal tissues whose radiation sensitivity may significantly influence treatment planning and/or prescribed dose. Planning Organ at Risk Volume (PRV); Planning Organ at Risk Volume is defined using the same principles as for the PTV. An integrated margin must be added to the OR to compensate a variations in tissue and patient position e.g., and other uncertainties. Lev Tsvang
ICRU Report 50 Conformity Index A Conformity Index (CI) can be employed when the PTV is fully enclosed by the Treated Volume, then being the quotient of the Treated Volume of the PTV. The (CI) can be used as part of the optimization procedure PTV ______________ CI = Treated Volume Lev Tsvang
ICRU Report 50 Dose Specification for Reporting In order to make exchange of information precise and accurate, it is important that treatments performed in different centers be reported inthe same way, using the same concepts and definitions. The present system of recommendations for reporting doses is based on the selection of a point within thePTV, which is referred to astheICRU Reference Point. The ICRU Reference Point The ICRU Reference Point is located: - always at the center (or in central part) of the PTV and - when possible, at the intersection of the beam axes. Lev Tsvang
ICRU Report 50 Dose Specification for Reporting The ICRU Reference Point (continue) The ICRU Reference Point shall be selected according to the following general criteria: 1.the dose at the point should be clinically relevant; 2.the point should be easy to define in a clear and unambiguous way; 3.the point should be selected so that the dose can be accurately determined; 4.the point should be in a region where there is no steep dose gradient. Lev Tsvang
ICRU Report 50 Dose Specification for Reporting The Dose Variation Throughout the CTV Tumor control depends on the dose to the CTV and its variation. However, the variation in CTV dose can only be estimated from the variation in the PTV dose. According to the recommendations already published, as a basic requirement, the following doses shall be reported: - the dose at the ICRU Reference Point; - the maximum dose to the PTV; - the minimum dose to the PTV. The minimum dose to theCTVis concerned, it is be by definition, equal or larger than the minimum dose to thePTV. The recommendations for the PTV doses are: - minimum of the PTV dose is 95% of prescription dose; - maximum of the PTV dose is 107% of prescription dose; Lev Tsvang
End of presentation Lev Tsvang
Dose computation Percentage depth dose (PDD) Dd _____ x P = 100 Dd o Effect of field size and shape Surface of phantom Method of equivalent square, circles fields A – area of rectangular field P – perimeter of rectangular field d o a, b – width and lenght of rectangular field x D d d o x D d r – radii of equivalent circles Lev Tsvang