Download
1 / 14
150 likes | 269 Views
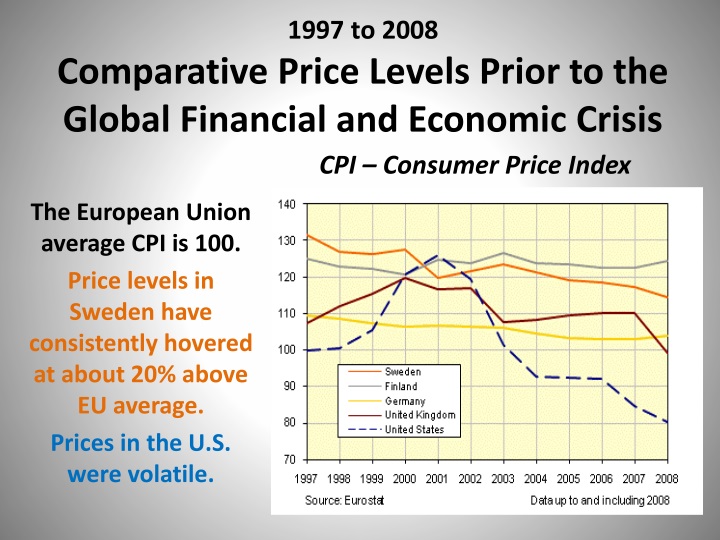
CPI – Consumer Price Index. 1997 to 2008 Comparative Price Levels Prior to the Global Financial and Economic Crisis. The European Union average CPI is 100. Price levels in Sweden have consistently hovered at about 20% above EU average. Prices in the U.S. were volatile.

E N D
CPI – Consumer Price Index 1997 to 2008Comparative Price Levels Prior to the Global Financial and Economic Crisis The European Union average CPI is 100. Price levels in Sweden have consistently hovered at about 20% above EU average. Prices in the U.S. were volatile.
Although Sweden’s Price Levels are High, They are Fairly Stable This CPI graph reflects the short-lived recession caused by the 2008 Global Financial and Economic Crisis Nation uses economic strategies to keep prices stable Inflation Targeting Fiscal Responsibility Conservative Spending Ceilings
National Environmental Goals Affect Energy Product Prices • Desire to be energy independent led to heavy investment in alternative energy sources. • With alternative energy sources available, oil consumption is reduced. • Percentage of Sweden’s energy coming from oil has decreased from 77% in 1970 to less than 32% today.
Targeted Tax Structures Ensure Complete Reduction of Oil Consumption Sweden is now confident they can be an “oil-free nation” by the year 2020. • In 1991, Sweden added a Carbon Dioxide tax to fossil fuels. The highest percentage tax is levied on oil. • Bio-fuels are not taxed and, therefore, are relatively less expensive. • Renewable energy vehicles are exempt from tolls and parking fees.
Price Comparison One Gallon of Gasoline Using August, 2011 Prices Levied taxes increase prices which reduces demand for fossil fuels.
National Goal to Reduce Alcohol Consumption Affects Liquor Prices • Swede’s are notoriously heavy drinkers. • State believes that private companies selling alcohol for profit will encourage consumption. • Government uses a non-profit nationally owned monopoly on alcohol as an attempt to control consumption.
Systembolaget Monopoly Controls Alcohol Prices • High taxes based on alcohol content attempt to reduce demand. • As the product proof increases, so does the tax percentages. • Hard liquor is relatively more expensive than beer or wine. • Ferry trips to buy liquor in Denmark and Germany are common.
Price Comparison One Liter Bottle of Absolut Vodka Systembolaget $36.19 (239SEK) Pennsylvania State Store $23.95
Poor Competition Plays a Role in Sweden’s High Prices Non-Tariff Barriers Municipal Planning Restricts Number of Retailers in Markets Government Controlled Housing Rental Market Returns Low Yields for Private Investors
Municipal Planning Curbs Efficient Competition among Grocery Markets • New retailers must be approved by municipalities. • Approval process discourages entrepreneurs. • Lack of competition exerts no force to drive prices down. ICA Maxi Retailing Corporation Holds a 50% market share.
Price Comparison Grocery Basket Swedish Basket Milk 5.68 gallon Eggs 4.06per dz. Coffee 6.43per lb. Beef 5.50per lb. Chicken 1.50per lb. Apples 3.13per lb. Us Basket Milk 3.71 gallon Eggs 1.71per dz. Coffee 5.77per lb. Beef 3.21per lb. Chicken 1.29per lb. Apples 1.52per lb.
Regional Rent Tribunals Dictate Price Ceilings • Strict pro-tenant controls keep rental rates down. • Price ceilings limit supplier’s returns on investment. • Suppliers can’t afford to invest with low returns. • Shortages create black market sub-leasing at above market prices.
Housing Shortages Push Prices Up • Demand for individual ownership of real estate has increased. • Increased demand along with shortage of housing supply has pushed prices up since the mid 1990’s. • Real estate bubble is now bursting.
Price Comparison Single Family House Upsalla, Sweden 2500 sq. ft. $1,047,816 Ithaca, New York 2500 sq. ft. $425,000