Download
1 / 13
140 likes | 662 Views
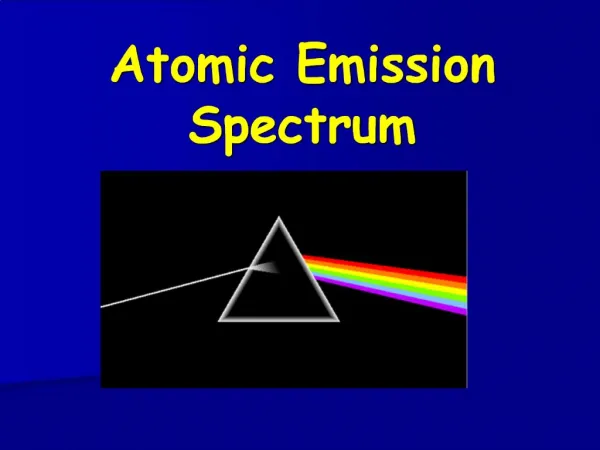
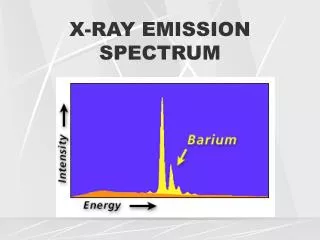
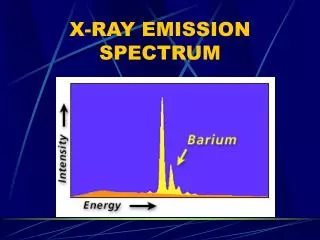
Emission Spectrum Animation. Light and Energy. The electromagnetic spectrum Particles (photons) and waves at the same time! c = f The greater f (frequency), the smaller (wavelength) The greater f, the higher the energy of the EM radiation. Energy = hf

E N D
Light and Energy • The electromagnetic spectrum • Particles (photons) and waves at the same time! c = f • The greater f (frequency), the smaller (wavelength) • The greater f, the higher the energy of the EM radiation. Energy = hf h is Plank’s Constant = 6.6262x10⁻³⁴Js
Energy and Frequency • The higher the frequency, the greater the energy
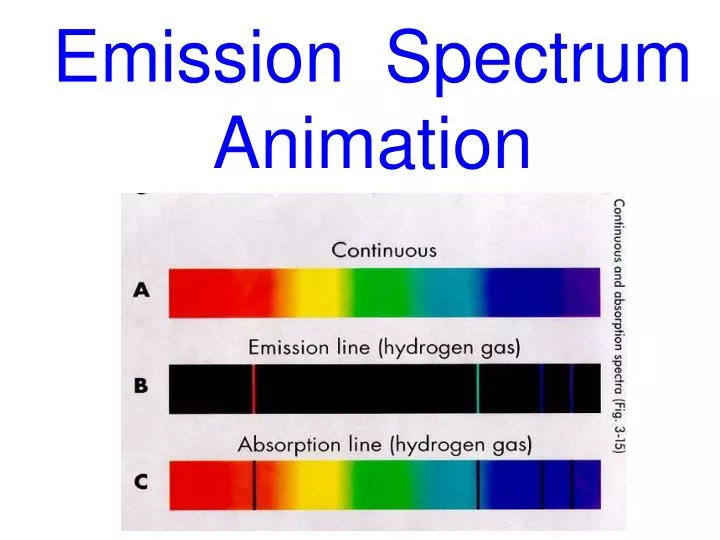
Emission spectra known for hundreds of years • Niels Bohr suggests a reason – energy levels • Electrons orbiting in shells around the nucleus • Energy levels differ from one another
Electrons and Light • When an atom absorbs energy, electrons are promoted to higher energy levels. • When the atom releases the absorbed energy, the electron falls back down to lower energy levels and EM radiation is given off (sometimes light)
There are only certain posibilities • Electrons can only exist at discrete energy levels • Therefore, in changing levels, only certain amounts of energy can be released • These amounts are unique to every element
A Demo • http://www.visionlearning.com/library/flash_viewer.php?oid=1347&mid=51 • http://jersey.uoregon.edu/vlab/elements/Elements.html • http://www.youtube.com/watch?v=QI50GBUJ48s
Spectrum Excited State n=4 UV Excited State n=3 Excited State unstable and drops back down Vi s ible Excited State But only as far as n = 2 this time n=2 • Energy released as a photon • Frequency proportional to energy drop IR n=1 Ground State
Summary • Electron normally in Ground State • Energy supplied [ as heat or electricity] • Electron jumps to higher energy level • Now in Excited State • Unstable • Drops back to a lower level
Energy that was absorbed to make the jump up is now released as a photon • Frequency depends on difference in energy levels [ E2 - E1 = hf ] h is Plank’s Constant and f is frequency of light • When electron falls to n = 1 level gives UV Range n = 2 level gives Visible Range n = 3,4 or 5 levels gives IR Range