Download
1 / 1
10 likes | 58 Views
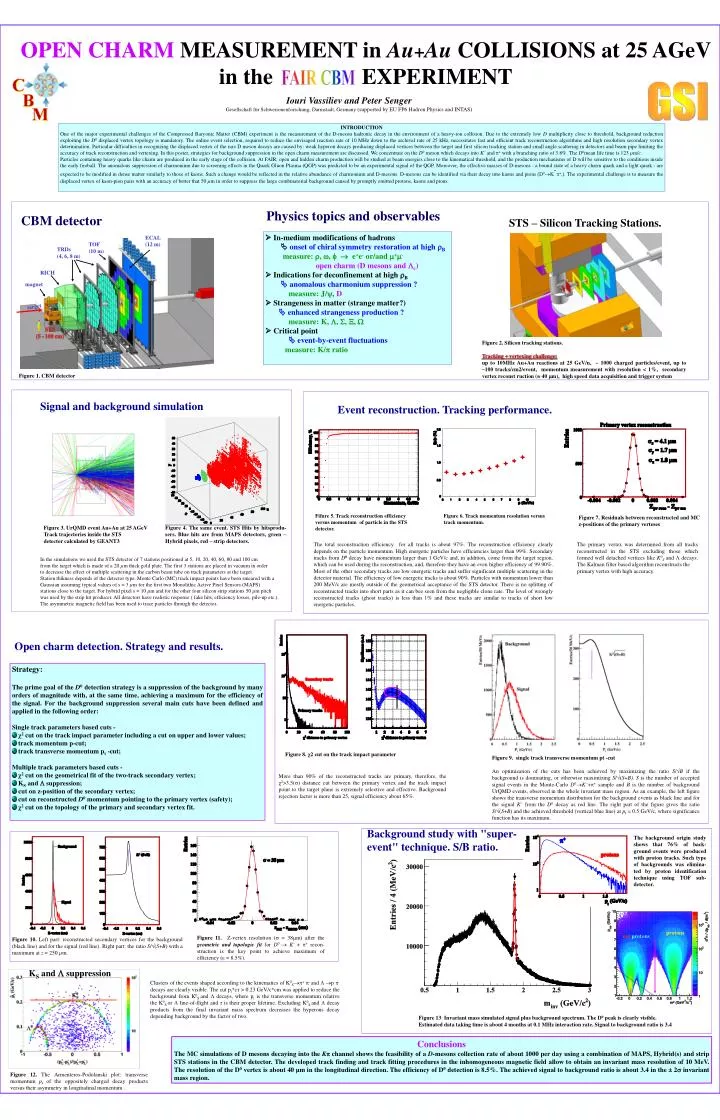
Figure 8. χ 2 cut on the track impact parameter. Figure 9. single track transverse momentum pt -cut.

E N D
Figure 8. χ2 cut on the track impact parameter Figure 9. single track transverse momentum pt -cut An optimization of the cuts has been achieved by maximizing the ratio S/B if the background is dominating, or otherwise maximizing S/(S+B). S is the number of accepted signal events in the Monte-Carlo D0K−++ sample and B is the number of background UrQMD events, observed in the whole invariant mass region. As an example, the left figure shows the transverse momentum distribution for the background events as black line and for the signal K− from the D0 decay as red line. The right part of the figure gives the ratio S/(S+B) and the achieved threshold (vertical blue line) at pt= 0.5 GeV/c, where significance function has its maximum. More than 90% of the reconstructed tracks are primary, therefore, the χ2>3.5() distance cut between the primary vertex and the track impact point to the target plane is extremely selective and effective. Background rejection factor is more than 25, signal efficiency about 65%. OPEN CHARM MEASUREMENT in Au+Au COLLISIONS at 25 AGeV in the EXPERIMENT FAIR CBM GSI Iouri Vassiliev and Peter Senger Gesellschaft für Schwerionenforschung, Darmstadt, Germany (supported by EU FP6 Hadron Physics and INTAS) INTRODUCTION One of the major experimental challenges of the Compressed Baryonic Matter (CBM) experiment is the measurement of the D-meson hadronic decay in the environment of a heavy-ion collision. Due to the extremely low D multiplicity close to threshold, background reduction exploiting the D0 displaced vertex topology is mandatory. The online event selection, required to reduce the envisaged reaction rate of 10 MHz down to the archival rate of 25 kHz, necessitates fast and efficient track reconstruction algorithms and high resolution secondary vertex determination. Particular difficulties in recognizing the displaced vertex of the rare D meson decays are caused by: weak hyperon decays producing displaced vertices between the target and first silicon tracking station and small angle scattering in detectors and beam pipe limiting the accuracy of track reconstruction and vertexing. In this poster, strategies for background suppression in the open charm measurement are discussed. We concentrate on the D0 meson which decays into K− and + with a branching ratio of 3.8%. The D0mean life time is 123 µm/c. Particles containing heavy quarks like charm are produced in the early stage of the collision. At FAIR, open and hidden charm production will be studied at beam energies close to the kinematical threshold, and the production mechanisms of D will be sensitive to the conditions inside the early fireball. The anomalous suppression of charmonium due to screening effects in the Quark Gluon Plasma (QGP) was predicted to be an experimental signal of the QGP. Moreover, the effective masses of D-mesons - a bound state of a heavy charm quark and a light quark - are expected to be modified in dense matter similarly to those of kaons. Such a change would be reflected in the relative abundance of charmonium and D-mesons. D-mesons can be identified via their decay into kaons and pions (D0K-+,). The experimental challenge is to measure the displaced vertex of kaon-pion pairs with an accuracy of better that 50 µm in order to suppress the large combinatorial background caused by promptly emitted protons, kaons and pions. Physics topics and observables CBM detector STS – Silicon Tracking Stations. In-medium modifications of hadrons onset of chiral symmetry restoration at high B measure: , , e+e- or/and +- open charm (D mesons and c) Indications for deconfinement at high B anomalous charmonium suppression ? measure: J/, D Strangeness in matter (strange matter?) enhanced strangeness production ? measure: K, , , , Critical point event-by-event fluctuations measure: K/ ratio ECAL (12 m) TOF (10 m) TRDs (4, 6, 8 m) RICH magnet target STS (5 - 100 cm) Figure 2. Silicon tracking stations. Tracking + vertexing challenge: up to 10MHz Au+Au reactions at 25 GeV/n, ~ 1000 charged particles/event, up to ~100 tracks/cm2/event, momentum measurement with resolution < 1%, secondary vertex reconst ruction ( 40 m), high speed data acquisition and trigger system Figure 1. CBM detector Signal and background simulation Event reconstruction. Tracking performance. 900 tracks per event Fifure 5. Track reconstruction efficiency versus momentum of particle in the STS detector. Figure 6. Track momentum resolution versus track momentum. Figure 7. Residuals between reconstructed and MC z-positions of the primary verteses Figure 3. UrQMD event Au+Au at 25 AGeV Track trajectories inside the STS detector calculated by GEANT3 Figure 4. The same event. STS Hits by hitsprodu- sers. Blue hits are from MAPS detectors, green – Hybrid pixels, red – strip detectors. The total reconstruction efficiency for all tracks is about 97%. The reconstruction efficiency clearly depends on the particle momentum. High energetic particles have efficiencies larger than 99%. Secondary tracks from D0 decay have momentum larger than 1 GeV/c and, in addition, come from the target region, which can be used during the reconstruction, and, therefore they have an even higher efficiency of 99.90%. Most of the other secondary tracks are low energetic tracks and suffer significant multiple scattering in the detector material. The efficiency of low energetic tracks is about 90%. Particles with momentum lower than 200 MeV/c are mostly outside of the geometrical acceptance of the STS detector. There is no splitting of reconstructed tracks into short parts as it can bee seen from the negligible clone rate. The level of wrongly reconstructed tracks (ghost tracks) is less than 1% and these tracks are similar to tracks of short low energetic particles. The primary vertex was determined from all tracks reconstructed in the STS excluding those which formed well detached vertices like K0Sand decays. The Kalman filter based algorithm reconstructs the primary vertex with high accuracy. In the simulations we used the STS detector of 7 stations positioned at 5, 10, 20, 40, 60, 80 and 100 cm from the target which is made of a 20 µm thick gold plate. The first 3 stations are placed in vacuum in order to decrease the effect of multiple scattering in the carbon beam tube on track parameters at the target. Station thikness depends of the detector type. Monte Carlo (MC) track impact points have been smeared with a Gaussian assuming typical values of s = 3 µm for the first two Monolithic Active Pixel Sensors (MAPS) stations close to the target. For hybrid pixel s = 10 µm and for the other four silicon strip stations 50 µm pitch was used by the strip hit producer. All detectors have realistic response ( fake hits, efficiency losses, pile-up etc.). The asymmetric magnetic field has been used to trace particles through the detector. Open charm detection. Strategy and results. • Strategy: • The prime goal of the D0 detection strategy is a suppression of the background by many orders of magnitude with, at the same time, achieving a maximum for the efficiency of the signal. For the background suppression several main cuts have been defined and applied in the following order: • Single track parameters based cuts - • χ2 cut on the track impact parameter including a cut on upper and lower values; • track momentum p-cut; • track transverse momentum pt-cut; • Multiple track parameters based cuts - • χ2 cut on the geometrical fit of the two-track secondary vertex; • KS and suppression; • cut on z-position of the secondary vertex; • cut on reconstructed D0 momentum pointing to the primary vertex (safety); • χ2 cut on the topology of the primary and secondary vertex fit. Background study with "super-event" technique. S/B ratio. The background origin study shows that 76% of back-ground events were produced with proton tracks. Such type of backgrounds was elimina-ted by proton identification technique using TOF sub-detector. NOT proton protons notprotons Figure 11. Z-vertex resolution ( = 38m) after the geometric and topologic fit for D0 K− + + recon-struction is the key point to achieve maximum of efficiency ( = 8.5%). Figure 10. Left part: reconstructed secondary vertices for the background (black line) and for the signal (red line). Right part: the ratio S/(S+B) with a maximum at z = 250 µm. KS and suppression Clusters of the events shaped according to the kinematics of K0S+ - and p - decays are clearly visible. The cut pt*cτ > 0.23 GeV/c*cm was applied to reduce the background from K0Sand decays, where pt is the transverse momentum relative the K0S or line-of-flight and τ is their proper lifetime. Excluding K0Sand decay products from the final invariant mass spectrum decreases the hyperons decay depending background by the factor of two. Figure 13: Invariant mass simulated signal plus background spectrum. The D0 peak is clearly visible. Estimated data taking time is about 4 months at 0.1 MHz interaction rate. Signal to background ratio is 3.4 Conclusions The MC simulations of D mesons decaying into the K channel shows the feasibility of a D-mesons collection rate of about 1000 per day using a combination of MAPS, Hybrid(s) and strip STS stations in the CBM detector. The developed track finding and track fitting procedures in the inhomogeneous magnetic field allow to obtain an invariant mass resolution of 10 MeV. The resolution of the D0 vertex is about 40 µm in the longitudinal direction. The efficiency of D0 detection is 8.5%. The achieved signal to background ratio is about 3.4 in the ± 2 invariant mass region. Figure 12. The Armenteros-Podolanski plot: transverse momentum ptof the oppositely charged decay products versus their asymmetry in longitudinal momentum .