Download
1 / 43
430 likes | 643 Views
Immigration. Presented by Judith Gans Immigration Policy Project Director. A National Policy Issue With Significant Impacts at the Border. Topics To Be Covered. Global and national context of immigration Key immigration issues Numbers, countries of origin, categories

E N D
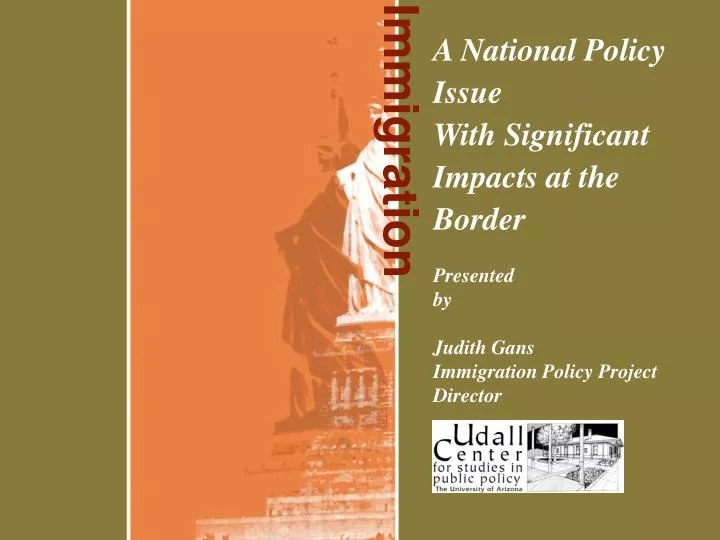
Immigration Presented by Judith Gans Immigration Policy Project Director A National Policy Issue With Significant Impacts at the Border
Topics To Be Covered • Global and national context of immigration • Key immigration issues • Numbers, countries of origin, categories • Economic impacts • Cultural and incorporation • Costs and contributions • National security • Politics and prospects for reform
A World-Wide Phenomenon UN estimates 190 to 200 million immigrants … ≈ 3.3 percent of the world's population • 30% in the Americas (Canada & US = 42 million immigrants) • 20% in Europe • Remaining 50% around world with largest share in Asia Source: Papademetriou, Demetrios G., “The Global Struggle with Illegal Immigration: No End in Sight”, Washington DC: Migration Policy Institute, September 1, 2005.
Immigration and Globalization • Cause and consequence of global economic integration • Communications and travel easy • Worldwide, remittances estimated at $150 billion per year Source: Papademetriou, Demetrios G., “The Global Struggle with Illegal Immigration: No End in Sight”, Washington DC: Migration Policy Institute, September 1, 2005.
U.S. History = Immigrant History • Integration into social, political, and economic fabric of the nation • Laws evolve with the economic, social, and political climate of each era • Current policy environment difficult
“As a sovereign nation, it has always been important that we control our borders.” “Message from the Commissioner”, National Border Patrol Strategy, Office of Border Patrol, U.S. Customs and Border Protection
But Sovereignty Blurs at the Border • Border = center of a region & gateway • Identities, affiliations cross political boundary • Policy set nationally • Multiple sovereign entities
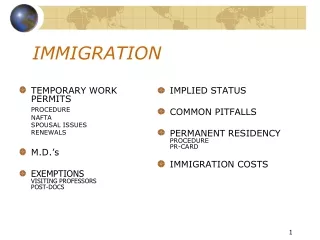
Key U.S. Immigration Issues • Numbers, countries of origin • Foreign workers, family reunification, & unauthorized immigration • Economic impacts • Culture and incorporation • Costs and contributions • National security
Immigration to the U.S. Growing Source: U.S. Census Bureau
Significant Demographic Impacts • 20% of births in the U.S. occur to foreign-born mothers • Directly and indirectly, immigration accounts for about 60% of U.S. population growth Source: Bean, Fank & Gillian Stevens, America’s Newcomers and the Dynamics of Diversity, New York: Russell Sage Foundation, 2003.
Countries of Origin Have Shifted Source: U.S. Census Bureau
Laws Try to Limit Economic Migration • Architecture of family reunification • Economic migration laws seek to: • Minimize competition with U.S. workers • Provide for scarce labor - Seasonal agricultural workers - Other seasonal workers - High skilled workers
35.7 Million Foreign Born in U.S.(2004 estimates*) * Estimates based on 2004 Current Population Survey. Published in Passel, Jeffrey, “Unauthorized Migrants: Numbers and Characteristics”, Pew Hispanic Center, Washington, DC, June 2005. www.pewhispanic.org
Unauthorized Arrivals Exceed Legal Arrivals Since the Mid-1990s Estimates based on 2004 Current Population Survey. Published in Passel, Jeffrey, “Unauthorized Migrants: Numbers and Characteristics”, Pew Hispanic Center, Washington, DC, June 2005. www.pewhispanic.org
Most Unauthorized Immigrants From Latin America(Share of estimated 10.3 unauthorized immigrants) * Estimates based on 2004 Current Population Survey. Published in Passel, Jeffrey, “Unauthorized Migrants: Numbers and Characteristics”, Pew Hispanic Center, Washington, DC, June 2005. www.pewhispanic.org
Immigration Status Impacts Employment Estimates based on 2004 Current Population Survey. Published in Passel, Jeffrey, “Unauthorized Migrants: Numbers and Characteristics”, Pew Hispanic Center, Washington, DC, June 2005. www.pewhispanic.org
Immigration Status Impacts Income (Incomes, 2003 Family Size 2004) Estimates based on 2004 Current Population Survey. Published in Passel, Jeffrey, “Unauthorized Migrants: Numbers and Characteristics”, Pew Hispanic Center, Washington, DC, June 2005. www.pewhispanic.org
Immigration Status Impacts Educational Attainment of Children (Share of each group’s 18-24 year old population, 2004) Estimates based on 2004 Current Population Survey. Published in Passel, Jeffrey, “Unauthorized Migrants: Numbers and Characteristics”, Pew Hispanic Center, Washington, DC, June 2005. www.pewhispanic.org
Immigration Status Impacts Educational Attainment of Adults(Share of each group’s 25-64 year old population, 2004) Estimates based on 2004 Current Population Survey. Published in Passel, Jeffrey, “Unauthorized Migrants: Numbers and Characteristics”, Pew Hispanic Center, Washington, DC, June 2005. www.pewhispanic.org
Unauthorized Immigration Matters • Failure to control borders: • Undermines sovereignty • Creates national security risks • Undermines formulation of coherent policy • Makes the border a dangerous place “It is difficult to open the front door without closing the back door.”
Immigration and National Security • National security requires more than border control • All 9/11 terrorists were in the U.S. legally • Enforcement no substitute for intelligence • Yet… border control imperatives obvious
Enforcement and National Security • Ambivalence about enforcement • Focus at border • Minimal interior enforcement • Verifying immigration status difficult • Ambivalence about controlling immigration • Limits to visible categories • Adjustments to numbers of temporary visas • Adjustments to enforcement intensity
Demographics Realities • Slow U.S. population growth creates tight labor markets and raises wages Between 1996 and 2000 (Economic boom) • U.S. economy generated 14.3 million new jobs • U.S. population increased by 12.3 million people including immigration • Strong ‘pull’ factor during economic boom Source: U.S. Bureau of Labor Statistics, 2002
Changed Profile of U.S. Labor • Greater proportion of low-skilled labor • Lowers wages of native born low-skill workers • Affects economic output mix • Increase in high skilled labor • Some crowding out of native-born workers • Providing for scarce labor (i.e. high tech) Source: Hanson, Gordon G., “Why Does Immigration Divide America: Public Finance and Political Opposition to Open Borders”, University of San Diego and NBER, March 2005.
Economic Impacts Not Uniform • Benefits and costs distributed unevenly • Owners of capital, owners of land, and employers gain most • Taxpayers in high immigrant-receiving states bear fiscal costs • Net economic impact is small, but… • Potentially large impacts on income distribution • Distribution impacts shape opinions about immigration policy. Source: Hanson, Gordon G., “Why Does Immigration Divide America: Public Finance and Political Opposition to Open Borders”, University of San Diego and NBER, March 2005.
Immigrant Incorporation and Integration to U.S. Society …What happens once people are here
Debates Over Incorporation • Assimilation = ‘they’ become more like ‘us’ • Socio-cultural assimilation precursor to economic assimilation • Incorporation = ‘we’ become more like ‘each other’ • Identity and ethnicity seen as complex
Some Markers of Incorporation • English language acquisition • Educational attainment • Earnings and employment
English Language Acquisition Percent speaking English well or very well after 10 years in the U.S. : • 52% of Mexican immigrants • 63% of immigrants from other non-English-speaking countries Members of other (non-Mexican) immigrant groups more likely to: • be fluent in English • to marry outside of their national-origin group but… Differences between Mexican and other immigrants do not appear large enough to warrant significant concern
Education and Earnings • Immigrants more likely to enroll in grades 1-12 and college • Schooling directly tied to closing wage gaps between immigrants and native-born workers • Immigrants benefit more from graduating from college than do natives • Returns to education varies across ethnic groups (Asians and whites benefit more than do Hispanics) Source: Betts, Julian R & Magnus Lofstrom, “The Educational Attainment of Immigrants: Trends and Implications”, NBER Working Paper #6757, National Bureau of Economic Research, Cambridge MA, October 1998.
Education and Incorporation • Central to immigration debates and to immigrant incorporation • Significant arena of competition between immigrants and native-born • Immigrants benefit from education through narrowing wage gaps with native workers • Some evidence that immigrants crowd native-born (esp. minorities) out of schools and, to some extent, college. Source: Betts, Julian R & Magnus Lofstrom, “The Educational Attainment of Immigrants: Trends and Implications”, NBER Working Paper #6757, National Bureau of Economic Research, Cambridge MA, October 1998.
Fiscal Impacts Conditional • Low-skilled immigrants: • earn relatively low wages • contribute relatively little in taxes • enroll in entitlement programs with relatively high frequency. • make greater use of welfare programs than natives • Net fiscal impact depends both on: • Size and mix of immigrant population • Generosity of state public services
Impacts Vary Across the U.S. • Tax structures and spending policies of U.S. states vary significantly • California and New York have high state income taxes and generous public benefits • Florida and Texas have no state income tax and provide far fewer benefits • States also vary in the size of immigrant populations
Many Dimensions to Fiscal Impacts For Example: • Social Security contributions from invalid numbers held in ‘Earnings Suspended File’ • 1986: annual inflows = $7 billion • 2000: annual inflows = $49 billion • by 2003: amount in Earnings Suspense File = $463 billion
History of ‘Imported’ Labor • Chinese immigrants - trans-continental railroad, 1860s • Mexican Bracero immigrants - southwestern agriculture, 1940s • Mexican, Latin American, Asian immigrants, 1970s on - agriculture, construction, service, & “non-tradeables”
‘Importing’ Labor is Complicated • Workers vs. citizens • Facilitates: • Limiting rights • Social divisions • Inherent power imbalance
*From Tichenor, Daniel, Dividing Lines: The Politics of Immigration Control in America, Princeton University Press, Princeton University, 2002. Politics of Immigration Debates
Major Themes and Conclusions • Today’s immigration reflects a global economy • Economic and fiscal impacts are complex • U.S. culture is robust in the presence of immigrants’ diversity • Current laws reflects complex political cross-currents and interests • Reform will be difficult and political voice is uneven