Download
1 / 60
600 likes | 740 Views
Rappel Classification de spectres. hierarchical clustering. Step 1: the Euclidian distance between each pair of spectra is calculated. Figure: 5 spectra represented in a 2-D space (say we recorded only the absorbance at two wavenumbers). Classification de spectres. hierarchical clustering.

E N D
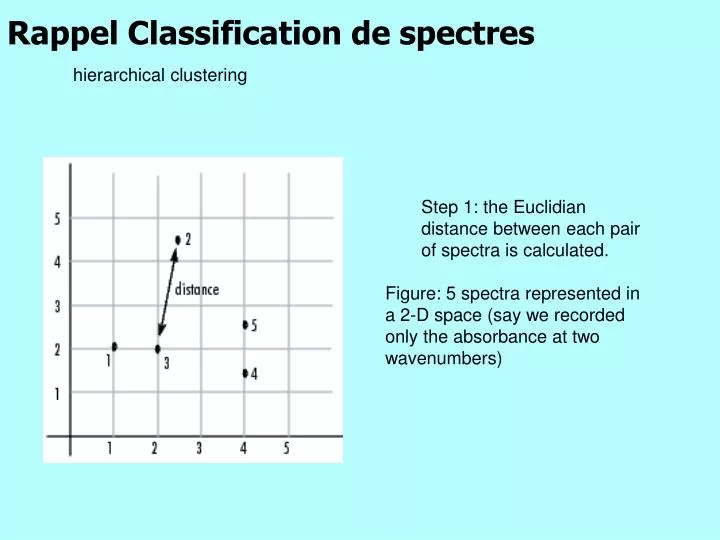
Rappel Classification de spectres hierarchical clustering • Step 1: the Euclidian distance between each pair of spectra is calculated. • Figure: 5 spectra represented in a 2-D space (say we recorded only the absorbance at two wavenumbers)
Classification de spectres hierarchical clustering • Step 2: grouping starts by linking the closest spectra. • Figure: grouping of spectra (#1 to 5) and clusters (beyond #5)
Classification de spectres hierarchical clustering • Step 3: dendrogram representation. • Statistical significance of the distances
Observations des données: recherche des régions spectrales corrélées
3- Information sur la conformation: corrélations p wavenumbers n spectra
3- Information sur la conformation: corrélations The variance An estimate of the spread of the results is given by the variance The variance can be found on the diagonal of the covariance matrix defined just below. The covariance The correlation coefficient This is a measure of the linear association between 2 wavenumbers i and k. Normalized by the standard deviation that exists on both variables, it does not depends on the units and is always included between –1 and +1.
50 spectres de protéines Variance
3- Information sur la conformation: corrélations Corrélation entre fréquences Covariance entre fréq i et k Série de n spectres (j=1:n) Matrice de covariance
3- Information sur la conformation: corrélations - 1545/1530 (/) - 1655/1630 (/) + 1530/1630 (/) +1690/1630 (/) - 1545/1630 (/) ? ? ? ? - 1530/1655 (/) - 1630/1655 (/) - 1690/1655 (/) +1545/1655 (/) Combien d’informations indépendantes? Où se trouve l’information? - 1545/1530 (/)
3- Information sur la conformation: corrélations ? 50 log lines Enhancement=100 near 0 Chaînes latérales ??
? 3- Rôle des chaînes latérales Glu hélices (la plus haute préférence pour les hélices) Asp tournants
3- Information sur la conformation: corrélations Extraire toute l’information corrélée en un petit nombre de paramètres: Analyse en composants principaux (PCA) On peut démontrer que les vecteurs propres de la matrice de covariance forment une base qui permet de décrire complètement les spectres Ces vecteurs propres on une corrélation nulle entre eux
3- Information sur la conformation: corrélations CP6: 1% CP5: 3% CP4: 5% CP3: 8% CP2: 18% CP1: 64% moyenne
3- Information sur la conformation: corrélations CP1 est une différence entre hélice et feuillet
3- Information sur la conformation: corrélations CP1 discrimine entre hélice et feuillet
3- Information sur la conformation: corrélations CP1 est une différence entre hélice et feuillet
Conclusions Les amide I et II contiennent de l’information sur la struct sec Certaines régions entre 1700 et 1500 cm-1 ne semblent pas corrélées à la struct sec (particulièrement 1600-1560 cm-1).
Imagerie FTIR Identification de phénotypes • Superposition de l’image optique classique à une image basée sur les spectres IR • Chaque pixel de l’image IR associé à un spectre IR • Représente soit l’absorbance à un nombre d’onde particulier soit une combinaison d’absorbances caractéristiques
FTIR imaging resolution? 16 µm 170 µm, 64 pixels Abso at 1655 cm-1
Abso 1655 cm-1 170 µm, 16 µm
Protein helices 520 µm 2.7µm/pixel 36864 spectra >108 data points
1468 cm-1 Lipid chains
Unsupervised classification Normalized Cluster analysis
Fibrosis vs Tumor Samples Tissue sections are cut from fixed, paraffin-embedded tissue blocks using a microtome Corresponding deparafined section of the sample H&E stained breast carcinoma sample Tumor Fibrosis
Results:GG1 vs GG3 Samples TMA’s : Tissue Micro Array 19 clinical cases of invasive breast carcinomas, 4 tissue cores per patient We know all the clinical parameters of these clinical cases Most of the time, HG1 and HG3 are well defined by the pathologist. So, HG1 -> GG1 and HG3 -> GG3
Microarrays analysis Gene expression profiling of breast tumors May lead to individualized management of patients => Gene expression grade index based on the expression of 97 genes is more correlated with relapse-free survival than histologic grade Clinical problem for breast cancer grading
Supervised classification • Number of spectra in the different classes • 1849 epithelium • 628 erythrocytes • 14 lymphocytes • 1605collagen/fibroblasts
Supervised classification • Number of spectra in the different classes • 1849 epithelium • 628 erythrocytes • 14 lymphocytes • 1605collagen/fibroblasts
Unsupervised classification PCA analysis IMPReS August 2011
Unsupervised classification PCA analysis
Unsupervised classification PCA analysis
Unsupervised classification PCA analysis
Unsupervised classification PCA analysis