Download
1 / 41
520 likes | 1.17k Views
Characteristics of Populations. Recall…. Habitat – the place where an organism lives Species – organisms that resemble one another in appearance, behaviour , chemistry and genetic makeup and that interbreed, or have the ability to interbreed, with each other under natural conditions .

E N D
Recall… • Habitat – the place where an organism lives • Species – organisms that resemble one another in appearance, behaviour, chemistry and genetic makeup and that interbreed, or have the ability to interbreed, with each other under natural conditions
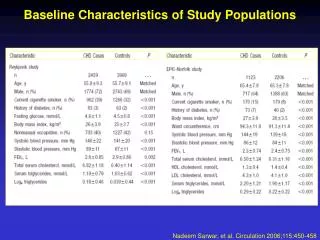
Population Size and Density • To study populations, scientists measure population size (the # of individuals in a population) and population density and dispersion of organisms. • Population Density is the # of individuals of the same species that occur per unit of volume. • D = N/S Where: D = density N = # of individuals counted S = space occupied
Some space within a habitat may be unusable to the population. • Crude density – is the # of individuals of the same species per total unit area. • Ecological density – is the # of individuals of the same species per unit area actually used.
Population Dispersion • Is the general pattern in which individuals are distributed throughout a specific area. • 3 main patterns: Clumped dispersion: organisms are densely grouped in areas with favourable conditions, most common pattern.
Uniform dispersion: individuals are evenly distributed throughout the area. Random dispersion: individuals are spread out in an unpredictable manner.
Measuring Population Characteristics • Biologists use a variety of sampling techniques to estimate the size and density of wild populations. • For small or stationary organisms the quadrat method is used. • A sampling frame or a grid is placed in an area to be analyzed • # of individual of one or more species is counted within each quadrat • Population size and density can be estimated based on the represented sample • Results are extrapolated to the entire area
Practice: A student wants to estimate the population size and density of ragweed plants in a large field measuring 100m x 100m. She randomly places three 2m x 2m quadrats in the field. Estimate the population size and density if she finds 18, 11 and 24 ragweed plants in the three quadrats.
Practice: To estimate the size of a slug population on a golf course, a student randomly selects five 1m2 quadrats in a 10m x 10m site. The number of slugs in each quadrat were 4, 8, 9, 5, 1. Estimate the population size and density of the slugs in this study site.
Practice: In a study of eastern red-backed salamanders (Plethodoncinereus), a biologist randomly placed seven 1.0 by 1.0 meter quadrats in a field that measured 100m by 100m. Estimate the population size and density of the biologist found 0, 1, 1, 2, 0, 1 and 3 salamanders in the seven quadrats.
To estimate the size and density of mobile wildlife populations the mark-recapture method is used. • A sample of animals is captured, marked in some way (tagged), then released • After a period of time, a second sample is captured • The proportion of marked animals to unmarked animals is calculated and used to estimate the size of the entire population
Assumptions of the Mark-Recapture Method • The accuracy of this method are based on 3 assumptions: • Every organism in the population has an equal opportunity being captured. • During the time period between the initial marking and the subsequent recapture, the proportion of marked to unmarked animals remains constant. • The population size does not increase or decrease during the sampling study.
Practice: Consider a fish population of unknown size from which 26 individuals are randomly captured, marked and released. If a second sample of 21 individuals captured sometime later in which 3 individuals are found to be marked, estimate the population size.
Practice: Using the mark-recapture method, wildlife researchers surveyed an area of wetlands where 80 wood ducks were captured in traps, marked with metal bands, and then released. Two weeks later, 110 wood ducks were captured, 12 were marked. Estimate the total size of the wood ducks in the survey area.
Practice: Imagine that you capture a sample of 180 butterflies in a park, mark them, and then release them. A week later, you recapture 210 butterflies and find that 30 are marked. Determine the estimated butterfly population in the park during the study period.
Measuring and Modeling Population Change • During any given time period, biotic and abiotic resources are finite in an ecosystem. • This puts a limit to the number of organisms that an environment can support. • Carrying capacity refers to the maximum number of organisms that can be sustained by available resources over a unlimited period of time. • Carrying capacity is dynamic since environmental conditions are always changing. • A variety of factors, like population size and density, affect the carrying capacity of an ecosystem.
Factors that Affect Population Growth • Population dynamics refers to changes in population characteristics due to natality, mortality, immigration and emigration. • The characteristics of the species themselves will also impact the population’s dynamics.
Fecundity is the potential for a species to produce offspring in one lifetime. • Some females have the ability to produce many offspring in a lifetime, while other females will produce few offspring e.g.: starfish can lay 1 million eggs/yr, hippos only produce 20/lifetime • A species lifespan must also be taken into consideration, longer lived species will complete more reproductive cycles.
Survivorship Patterns • Three general patterns in the survivorship of species – the proportion of individuals in a population that survive to a given age Type 1 – low mortality rates until beyond reproductive years, long lifespan. Type 2 – show a uniform risk of mortality throughout life time. Type 3 – very high mortality rates when young, rate reduces if sexual maturity is reached.
Survivorship Curves Decreasing levels of initial parental care or investment in young
Calculating Changes in Population Size • The population growth of any population can be calculated using the following formula: • If the number of births and immigration exceeds the number that died and emigrated, the population will have positive growth. • Negative growth will occur when deaths and emigration exceed births and immigration.
The type of growth that a population exhibits is dependent upon what type of it is. • An open population is one that is influenced by all four factors (birth, death, immigration and emigration). • A closed population is one that is influenced only by births and deaths. • Most wild populations are considered open, as organisms are free to enter or leave the population.
Biotic Potential • Biotic potential is the maximum rate a population can increase under ideal conditions • Factors that determine biotic potential include • Number of offspring per reproductive cycle • Number of offspring that survive until reproductive age • Age of reproductive maturity • Number of times an individual will reproduce in a lifetime • Life span of the individuals
Population Growth Models • Growth patterns in a population can be described as geometric, exponential or logistic • This depend on the pattern or frequency of reproductive behaviour in the species, as well as whether there are any limits on natural resources available to the population
Geometric Growth • Some species reproduce only during a breeding season, yet deaths can occur at any time of year • This results in rapid growth during breeding season and a gradual decline during the remainder of the year
Exponential Growth • Some species are able to reproduce on a continuous basis • Any population that grows at it’s biotic potential (ie: with no limitations) will exhibit exponential growth (green line on graph)
Logistic Growth • If fruit flies were able to grow without limits, they would carpet the earth a meter deep in a few months • Clearly then, populations rarely grow in an exponential rate • There is usually some limitation in resources which slows the population’s growth
Logistic Growth • Pattern includes a lag phase of slow growth when there are few individuals • Rapid growth occurs during the log phase when resources have not yet become limited • No growth or or stationary phase occurs when the resources are limiting the population so that births=deaths • The stationary phase occurs close to and often fluctuates around the carrying capacity (K)
Logistic Growth Stationary phase K Log phase Lag phase
Factors Affecting Population Change • Populations do not live in isolation – there are many factors which affect them • There are also interactions between members of the same species and individuals from different species
Density-Independent Factors • A factor that limits population growth that is not related to the population density. • These can include human intervention, extreme weather changes or changes in environmental conditions. • Limiting factors prevent population from reaching their biotic potential. • These limiting factors may be shortages of environmental resources as light, space, water or nutrients, and will determine the carrying capacity of the population. • Of all the resources that are required for growth, the one that is in shortest supply is called the limiting factor. • It determines how much the individual or population can grow.
Density-Dependent Factors • A factor that limits population growth that intensifies as the population increases in size. • The struggle for available resources within a growing population limits population size. For example, the spread of parasites (such as tapeworm) in a population – with low density, it is more difficult for the parasite to spread
Intraspecific competition • Occurs when individuals of the same species rely on the same resources for survival. • As the population density increases, there is more competition for resources, and so growth rate slows. • Stronger individuals will survive, while the weak may die or leave the area in search of resources. • Can also affect the reproductive success of individuals, no resources = decrease in individuals growth and reproduction.
Interspecific Competition • Competition for shared resources results in lower population sizes for one or both species involved Interference competition: physical conflict over shared resources, such as swallows and bluebirds competing for a limited number of birdhouses Exploitative competition: one species outcompetes another, limiting the resource availability for the other, such as in barnacle species Chthamalus and Balanus
Resource Partitioning • Some species will try to limit the competition for resources by selecting sections of a shared resource that does not overlap • Several bird species inhabit sections of trees that do not interfere with one another and reduce competition
Predation Predation - the consumption of prey by an individual of another species. • Some predators may prefer one type of prey over another, if the population is large and easier to catch. • Results in density-dependent regulation of the preferred prey species. • Faster prey and those that are more apt to hide will survive, while those that are slower will be easier prey.
Population Cycles • Predator-prey interactions can result in regular population cycles – alternating periods of large and small populations • Resulting pattern is wave-like or sinusoidal • Lynx-Hare interactions in the boreal forest • Lemming-Stoat interactions in the arctic
Defense Mechanisms • predator-prey species interactions drive evolutionary adaptations – defense mechanisms are some of these which help a prey species avoid capture • Quills in porcupines • Thorns in cacti • Toxins in many insect and plant species • Colouration for mimicry, camouflage, or warning • Mimicry can be Batesian or Mullerian
Disease • Disease can also limit a population size. • In dense, overcrowded populations, pathogens are able to pass form host to host easier, spreading at a faster rate. • Population decreases in size due to increased mortality. • Populations may also be affected when their densities are low or when they reach a small size. • This phenomena is called the allee effect. • If a population is too small it may be difficult to find mates, and offset the mortality rates. • Population size will continue to decrease until they can no longer survive.
Symbiotic Relationships • Means “living together”, where at least one of the species benefits from the interaction • A symbiotic is organism which lives or feeds off another organism, the host Parasitism: adzuki bean weevil and wasp parasitoid Mutualism: lichen – algae and fungus Commensalism: sharks and remoras