Download

1 / 65
690 likes | 848 Views
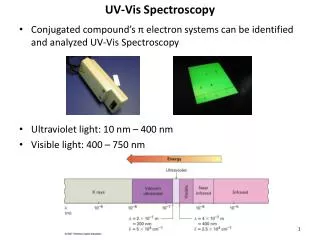
Applications of UV-Vis Spectroscopy. The Molar Absorptivity We have seen earlier that validation of Beer’s law is dependent on the nature of the molar absorptivity. It was found that the molar absorptivity is influenced by: The wavelength of radiation

E N D
The Molar Absorptivity We have seen earlier that validation of Beer’s law is dependent on the nature of the molar absorptivity. It was found that the molar absorptivity is influenced by: • The wavelength of radiation • The refractive index and is thus indirectly related to concentration • Electrostatic interactions taking place in solution; and thus electronic distribution • In rare cases, like methylene blue, the molar absorptivity is directly dependent on concentration
The molarabsorptivity, however, is supposed to be constant for Beer’s law to be valid. The molarabsorptivityis a measure of the ability of ananalyteto absorb light at a specified wavelength. Therefore, the value of the molarabsorptivityis crucial for the sensitivity of an analysis. The value of the molarabsorptivitycan usually range from zero (for anonabsorbingspecies) to 105 for highly absorbing species). For quantitative analysis, a value of at least 103 is necessary for a reasonable quantitative analytical determination of ananalyte.
Absorbing Molecular Species When an incident beam of radiation having a suitable wavelength hits a molecule, absorption of a photon takes place and the molecule becomes excited. Excited molecules will lose excitation energy as heat or photons (luminescence). Absorption of UV-Vis radiation is capable of affecting the excitation of bonding electrons and other valence electrons. Therefore, excitation of electrons in chemical bonds (p and s) or nonbonding electrons (n) is the result of absorption of UV-Vis radiation of a suitable wavelength. Absorption will thus be dependent on the availability of p and s bonds or n electrons that can absorb incident radiation.
Molecules Containing p, s, and n Electrons 1. Molecules with s Bonds Only Let us start with a molecule like CH4 and then expand our discussion to more complex molecules: All bonds in methane are s bonds and the only transition possible is the s-s* transition. However, the s-s* transition requires very high energy which occurs in vacuum UV.
It is not wise to think of doing UV measurements on molecular species in the vacuum UV region (125-185 nm) for five important reasons: • The high energy required can cause rupture of the s bonds and breakdown of the molecule • Air components absorb in vacuum UV which limits the application of the method • Working in vacuum UV requires special training and precautions which limit wide application of the method. • Special sources and detectors, other than those described earlier, must be used • All solvents contain s bonds
2. Molecules with n Electrons Electrons in the valence shell that are not used up in chemical bonds are referred to as nonbonding electrons (n electrons). Consider a molecule like ammonia: The line on nitrogen is a symbol for two nonbonding electrons. Now, the type of transitions observed in this molecule can be listed as: s-s* n-s* We have seen earlier that the s-s* transition is not useful in practical UV-Vis spectroscopy but the other transition (n-s*) is of lower energy and should be further discussed.
The absorption wavelength foran-s* transition occurs at about 185 nm where, unfortunately, most solvents absorb. For example, the most important solvent is, undoubtedly, water which has two pairs of nonbonding electrons that will strongly absorb as a result of the n-s* transitions; which precludes the use of this transition for studies in aqueous and other solvents with nonbonding electrons. In summary, it is also impractical to think of using UV-Visabsorption spectroscopy to determineanalytesbased onan-s* transition.
3. Molecules with p Bonds Absorption of radiation by an alkene, containing a double bond, can result in s-s* or p-p* transitions. We have seen that a s-s* transition is not useful but on the other hand, the p-p* turned out to be very useful since it requires reasonable energy and has good absorptivity. A molecule having s, p, and n electrons can show all types of transitions possible in UV-Vis spectroscopy. For example, an aldehyde molecule shows all these transitions since it contains s, p, and two pairs of n electrons. Two transitions are possible for the n electrons: n-s* n-p*
We have seen thatan-s* is not very useful due to absorbance from solvents and other frequently used additives which have n electrons. The n-p* transition requires very little energy and seem to be potentially useful. However, unfortunately, theabsorptivityof this transition is very small which precludes its use for sensitive quantitative analysis.
Effect of Solvent Polarity on Absorption Wavelength The molar absorptivity for a n-p* transition is rather small (10-100 L mol-1 cm-1) and the energy required for transition is affected by solvent polarity. In presence of a polar solvent, nonbonding electrons will interact with protic solvents to form hydrogen bonds. The solvation of n electrons is the result; which lowers the energy of the orbitals holding the n electrons. Partial stabilization of the polar p* is also observed but to a much lower extent than the n electrons.
A net increase in energy required for a n-p* transition is thus observed in protic solvents; like water or alcohols. Therefore, an increase in energy will reflect a decrease in transition wavelength, or what is called hypsochromic shift or blue shift.
On the other hand, a p-p* transition is affected in an opposite manner with solvent polarity. In presence of a polar solvent, the more polar p* orbital will be more stabilized than the p orbital leading to a net decrease in the transition energy. This results in an increase in transition wavelength or what is called a bathochromic shift (red shift).
Conclusions on Electronic Transitions A s-s* and a n-s* are not useful for reasons discussed earlier. The n-p* transition requires low energy but the molar absorptivity is also low and transition energy will increase in presence of polar solvents. The n-p* transition is seldom used in quantitative UV-Vis spectroscopy. The most frequently used transition is the p-p* transition for the following reasons: 1. The molar absorptivity for the p-p* transition is high allowing sensitive determinations. 2. The energy required is moderate, far less than dissociation energy. 3. In presence of the most convenient solvent (water), the energy required for a p-p* transition is usually smaller. It is therefore primitive that an analyte to be determined by UV-Vis absorption spectroscopy be of unsaturated nature (or!!).
Applications of UV-Vis Spectroscopy Lecture 26
Organic Chromophores Molecules having unsaturated bonds or free nonbonding electrons that can absorb radiation of relatively low energy are called chromophores. Examples include alkenes, alkynes, ketones, aldehydes, phenyl and other aromatic species, etc. Auxochromes An auxochrome is a functional group that does not absorb by itself (like -NH2 and -OH) , but its presence in a molecule can increase absorption and usually results in a red-shift.
The human eye sees the complementary color to that which is absorbed
Effect of Conjugation ofChromophores As conjugation is increased in a molecule, more delocalization (stability) of the p electrons results. The effect of this delocalization is to decrease the p* molecular orbital. The result is a decrease in transition energy from p-p* and thus a red or bathochromic shift. The molar absorptivity will increase in this case and better quantitative analysis will be achieved. In cases of introduction of more unconjugated double bonds, the molar absorptivity will increase as well depending on the number of the double bonds. For example, at 185 nm,1-hexene has a molar absorptivity of about 10,000 L mol-1 cm-1 but hexa-1,4-diene has a molar absorptivity of twice as much as 1-hexene. However, when the double bonds are conjugated as in hexa-1,3-diene the molar absorptivity is about 21,000 L mol-1 cm-1.
Rule of thumb for conjugation If greater then one single bond apart - e are relatively additive (hyperchromic shift) - l constant CH3CH2CH2CH=CH2lmax= 184 emax = ~10,000 CH2=CHCH2CH2CH=CH2lmax=185 emax = ~20,000 If conjugated - shifts to higher l’s (red shift) H2C=CHCH=CH2lmax=217 emax = ~21,000
Effect of AromaticityofChromophores On the other hand, aromaticity results in extraordinarily high degree of delocalization of electrons and thus stabilization of the p*. If we assume a molar absorptivity of about 10,000 L mol-1 cm-1 for each double bond, we expect the sum of the three double bonds in benzene to be just above 30,000 L mol-1 cm-1 (at 185 nm) but actually the value is about 60,000 L mol-1 cm-1 due to increased delocalization as a result of aromaticity. It is therefore advantageous to use UV-Vis absorption spectroscopy for determination of compounds having aromatic character.
Absorption by Inorganic Groups Inorganic groups containing double bonds absorb in the UV-Vis region. The most transitions are a result of n-p* transitions as in nitrate (313 nm), carbonate (217 nm), nitrite (280 and 360 nm) and azide (230 nm)
Absorption Involving d and fOrbitals Many transition metals have colored solutions and are also colored in the solid state. The transition metals have some of their d orbitals empty where a d-d transition can occur. The d-d transitions require excitation energy in the UV-Vis region. The direct interaction of the d electrons with ligands around the transition metal results in a spectrum of broad band nature. On the other hand, inner transition elements show transitions by absorption of UV-Vis radiation (f-f transitions). Since the electrons in the f orbitals are far inside the metal orbitals and are screened by electrons in orbitals of higher principal quantum numbers, f-f electronic transitions will not be affected by the nature of ligands or solvent around the inner transition metals. Therefore, the spectra of inner transition metals have narrow bands.
The crystal field theory is usually used to explain splitting of thedorbital energy so that a transition from a lower energydorbital electron can be excited to a higher energydorbital. The theory will be described for a transition metal with sixligandsor molecules of water around it. An octahedral (only this case will be discussed) arrangement of theseligandsis most appropriate whereligandswill be located at the z axis and at the x and y axis (will repel electronic cloud in thedz2anddx2-y2orbitalsand thus will make these twoorbitalsto have higher energies). The other fourligandswill be arranged in between axis (dxy, dxz, anddyz) which will increase their energies but to a lower extent. The net result is the splitting of the degeneratedorbital into two groups ofdorbitalsof different energies (the energy difference is referred to asD).
Charge Transfer Absorption When a ligand permanently donates an electron to a metal ion, a charge transfer is said to take place. The net outcome of the process is an oxidation reduction phenomenon occurring within the complex. An example is the reaction of Fe3+ with thiocyanate where the product is an excited species with neutral thiocyanate and Fe3+. In less common situations, the transfer of electrons can take place from the electron deficient metal ion to the ligand. An example is the Fe2+ or Cu+ complexes with 1,10-phenanthroline where Fe2+ and Cu+ metal ions donate electrons to 1,10-phenanthroline. The complex will then have Fe3+ and Cu2+ ions. Charge transfer complexes are of special interest their molar absorptivities are unusually high; allowing very sensitive determinations.
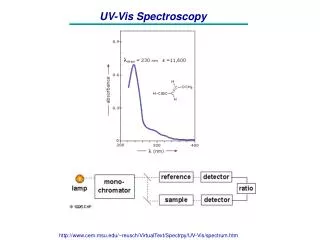
Applications of Absorbance Measurement to Qualitative Analysis As seen earlier, the broad band absorption spectra obtained in UV-Vis absorption spectroscopy is usually featureless and lacks details that can be used in qualitative analysis. Therefore, this technique is mainly a quantitative technique. Plotting Spectral Data A plot of either the absorbance or %transmittance against wavelength can be made. However, the most common practice is to plot the absorbance versus wavelength.
Applications of UV-Vis Spectroscopy Lecture 27
Solvents We have seen earlier that solvent polarity affects the absorptivity of the analyte molecules; due to change in transition energies. Usually, polar solvents are used when possible. However, polar solvents like water or alcohol tend to remove the fine spectral details. Therefore, in cases where the fine spectral details are really needed (as in qualitative analysis) a non polar solvent like hexane should be used. In addition, the solvent must be optically clear (does not absorb incident radiation), well dissolve the sample, and chemically pure.
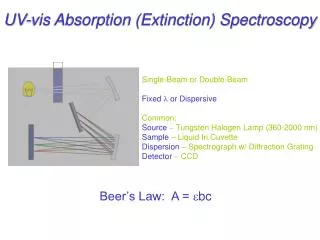
Quantitative Analysis The basis for quantitative analysis in the UV-Vis relies on Beer’s law. Several characteristics of quantitative measurements using UV-Vis absorption spectroscopy can be rationalized: 1. Applicability to all types of analytes as far as they absorb in the UV-Vis region. 2. Moderate sensitivities in the range from 10-4 to 10-6 with possibility to extend this range under certain conditions. 3. The relative standard deviation occurs within 1-3% which reflects good precision. 4. Easy to perform and convenient. 5. Can be used for quantitative analysis in liquid chromatographic separations. 6. Non absorbing species can also be determined if they are derivatized with an absorbing species as the case of metal ions when complexed to ligands.
Procedural Details • Selection of Wavelength The first step in a successful determination is to find the suitable wavelength for the analysis. This is accomplished by plotting the absorbance/wavelength curve. However, the following points should also be considered: • If more than an absorption maximum is available, the wavelength far from the instrument extremes should be preferred • A wavelength at the maximum of a broad peak should be preferred to another of a sharp peak • The peak with a maximum peak height is preferred • If interferences are present, the wavelength that is far away from interferences should be selected • Working in the visible region should be preferred
2. Cleaning and Handling the Cell First, one should appreciate the use of good quality matched cells that are free from wearing, etching, and scratches. In addition, cleaning procedures of external and internal cell surfaces are also important. A suggested cleaning procedure involves moistening a lens paper with methanol and wiping the external surface, then leaving the cell to evaporate. The interior of the cell is first washed with water followed by methanol and the solvent is also allowed to evaporate. Disposable polypropylene cuvettes are incompatible with non polar solvents and formulations having these solvents should be avoided; or large errors will be encountered.
3. Calibration Curves Usually, a plot of the absorbance of a series of standards is plotted versus the concentration. The absorbance of the unknown is then determined and the prepared calibration plot is used for the determination of the analyte concentration. If the absorbance of the analyte was located outside the calibration plot, more standars should be made or the analyte concentration must be adjusted to occur on the calibration plot. We have seen earlier that it is not allowed to theoretically extrapolate or interpolate a calibration plot. It should also be appreciated that the composition of standard solutions must approximate that of the sample solution. In cases where the sample composition is not clear, the method of standard addition should be used. The slope of the linear calibration plot is the molar absorptivity when the path length is 1.00 cm. Larger slopes mean higher sensitivities.
4. Standard Addition method The use of this method provides better correlations between absorbances of standards and sample due to constant matrix effects. The method involves addition of the same sample volume to a set of tubes or containers. Variable volumes of a standard are added to the tube set followed by completion to a specific volume. Now, all tubes contain the same amount of sample but different concentrations of analyte. A plot is then made for the volume of standard and absorbance. This plot will have an intercept (b) with the y axis and a slope equals m. The concentration of the analyte can be determined by the relation: Cx = bCs/mVx Where, Cx and Vx are concentration and volume of analyte and Cs is the concentration of standard.
One can only use two points to get the analyte concentration using the relation: Cx = AxCsVs/(At –Ax)Vx Where, Ax is the absorbance of the analyte solution brought to a final volume Vtand At is the total absorbance of the solution (final volume is Vt) containing same amount of analyte and a volume of the standard (Vs). However, this procedure assumes that both points occur at the linear portion of the calibration plot. In case where this is not true, an error will be encountered.
5. Analysis of Mixtures of Absorbing Substances When the sample solution contains more than one absorbing species, the absorbance of the solution will be the sum of all absorbances: At = A1 + A2 + A3 + …. The different constituents can be determined if we build equations equal to the number of unknowns. However, this procedure, if manually performed, is impractical due to lengthy and difficult math involved especially when more than two components are present. Remember that we need to calculate n2 values for e where n is the number of components. Al’ = ex’bcx + ey’bcy (1) Al” = ex”bcx + ey”bcy (2) ex’, ex”, ey’, ey” can be determined from standards of analytes x and y at l’, l” and values obtained are inserted in equations 1 and 2 where two equations in two unknowns can be easily solved.
6. Derivative UV-VisAbsorption Spectroscopy In derivative spectroscopy, DA/Dl is plotted against the wavelength. The derivative spectrum contains sharper peaks where better location of peaks and wavelengths maxima can be achieved. Not only the first derivative of the absorbance spectrum can be obtained but up to the fourth derivative is possible. However, as the differentiation order increases, the noise increases as well and if a lower derivative is fine, going to higher derivatives is a waste of time and effort. Derivative spectroscopy is excellent for determination of multi components in a sample, if they can be resolved.