Download
1 / 20
200 likes | 209 Views
Non-Tariff Barriers in Trading within the East African Community (EAC). By Monica A. Hangi Economic and Social Research Foundation (ESRF). Introduction. Economic, social and political agenda in EAC Trade as an identified catalyst for growth (the big market of EAC – 126.6 population

E N D
Non-Tariff Barriers in Trading within the East African Community (EAC) By Monica A. Hangi Economic and Social Research Foundation (ESRF)
Introduction • Economic, social and political agenda in EAC • Trade as an identified catalyst for growth (the big market of EAC – 126.6 population • EAC Development Strategy (2001-2005):NTBs - Administrative & Bureaucratic inefficiencies; standards and technical requirements; and infrastructure and communication networks • One of the solution: The CU Protocol, 2005
The Customs Union Protocol • Main aim: assuring an even development for all member countries • Crucial areas under the Protocol: Trade Facilitation; Anti-dumping measures; Competition Policy and law; Re-export of goods; Non-Tariff Barriers; and Standards and measures • Hence removal of the NTBs so as to improve intra-EAC trade
Main Problem • The EABC study of 2005, 8 categories of NTBs were identified • The declining trade trends in the early 2000s among EAC member states • Trade IS in fact affected by the NTBs in the region • Multiple membership for member states
Objectives of the Study MAIN: to promote the sustainable trade sector and the economic growth through elimination of trade and non-trade restrictions in the East African region SPECIFIC: • Identifying the NTBs hindering promotion of the regional cross-border trade based on member country comparative advantages; • Undertaking a review on the implementation of the current EAC CU Protocol and business environment promotion efforts; and • Drawing up recommendation based on the research findings
Research Questions • What trade barriers do exist in the region? • How do these trade barriers hamper trade promotion in the region? • What measures have been employed in removing these barriers? • What is the impact of the removal of these barriers to the trade performance within the EAC?
The East African Community (EAC) I: MACROECONOMIC PERFORMANCE (2008): • Rwanda recorded the highest growth (11.2%); Uganda (9.2%); Tanzania (7.4%); Kenya (decline to 1.7%); Burundi (a negative growth,0.025) – Table 1 • Decline in Balance of Payment position for all members; Fiscal deficit improved to 9.5% (from 10.5%) • Annual headline Inflation rates: Highest – Burundi (24.5%) and Kenya (26.2%) – Table 2
...Cont TRADE PERFORMANCE (2008): • Tanzania (Table 3): Trade with EAC member countries declined by 40.9% (to 54.9%); Exports and imports much to/from Kenya. But generally Tanzania intra-EAC trade levels have increased • Kenya (Table 4): Kenya’s share of trade with the rest of EAC increased to $ 1,031.4 million from $ 760.6 million; Exports much to Uganda and Tanzania and imports much from Tanzania. Kenya has low trading rates with Burundi and Rwanda
…Cont • Uganda (Table 5): Uganda mostly trades with Tanzania; Most of its exports are to Rwanda (with great improvement of up to $ 136.9 million from $ 83.3 million); there is an improvement in the trading trends with the EAC members • Burundi (Table 6): Burundi is picking up; Imports from Uganda and Kenya and Exports a bit (very low) to Rwanda, Uganda and Kenya
…Cont • Rwanda (Table 7): Improved performance as compared to previous years; Trades mostly with Kenya and Uganda. Rwanda exports to Kenya and very little to the rest of EAC; Imports from Kenya and Uganda Findings: The fluctuating trends are due to a number of reasons (such as the size of the economies; problem of markets; the quality of the products) including the NTBs
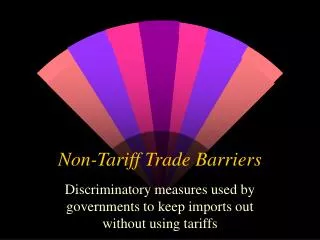
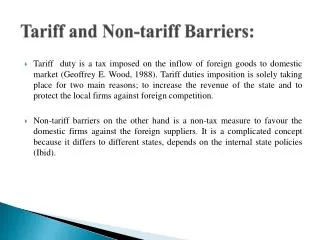
Non-Tariff Barriers (NTBs) • Trade barrier: Any restriction imposed on the free flow of trade. However, the EAC defines the NTBs as quantitative restrictions and specific limitations that act as obstacles to trade • Forms of NTBs: Import policy barriers; Standards, testing, labeling and certification requirements; Anti-dumping and countervailing measures; Export subsidies and domestic support and others
NTBs in the EAC In 2005, EABC commissioned a Business Climate Index (BCI) survey in EAC, in an effort to eliminate the NTBs in the region The 8 identified categories: • Customs and administrative documentation procedures; Immigration procedures; Cumbersome inspection requirements; Police road blocks; Varying trade regulations among the three EAC countries; Varying, cumbersome and costly transiting procedures in the EAC countries; Duplicated functions of agencies involved in verifying quality, quantity and dutiable value of imports and exports; and Business registration and licensing
Corruption in EAC • Corruption: In the region, corruption has carried the highest weight in slowing down the trade flows; Both as a portion to the NTBs and independently • Original EAC member countries: the study found Kenya to have been most corrupt and the TI for all the EAC countries found Burundi to be more corrupt; followed by Kenya, Uganda, Tanzania and Rwanda – Table 8
Elimination of the identified NTBs Based on the BCI survey done in 2008: • Uganda has the most favorable conditions; then Kenya, Rwanda, Tanzania and Burundi respectively • The BCI Survey 2008 findings (highlighted on Table 9); But generally: a total sum of 172,236 days are lost each year as a result of delays at Weighbridges, roadblocks and customs – with Weighbridges causing almost half of those delays. In terms of money (paid in the form of bribes), some 9.8 million USD are paid over per year – with Weighbridges again taking the largest share.
Impact of the CU on trade in EAC Tanzania’s trade performance: • Tanzania’s imports from Kenya and Uganda have been on the rise following the establishment of the CU; Exports have as well recorded a consistent increase, almost doubling in 2008 compared to 2004 Tanzania and Uganda: the trends before the Protocol were higher than after; and it’s the similar case for Uganda as well
…Cont Tanzania and Kenya: after the protocol, trade rates more than doubled; imports as well rose by approximately 50% Hence, the protocol seem to have had a marginal effect on the trade shares between Tanzania and other members of the region
…Cont Kenya’s trade performance: Kenya’s trade proportions within the region have been increasing since 2002 until 2008; with Uganda being the largest destination for the products and Tanzania is the largest exporter to Kenya. There is an issue of re-exports of products to/from Uganda and Kenya. Hence, Kenyan performance has managed to maintain its position within the region
…Cont Uganda’s trade performance: Uganda trades more in manufactured goods than agricultural products. With the protocol, it has registered both decreasing and increasing trends. Most of the imports are from Kenya, followed by Tanzania (even though b4 the protocol, imports from TZ kept declining until its introduction) Generally; the protocol has had positive impact on the trade performance between Uganda and the EAC member states
Conclusion • A full economic integration is still a challenge • With the identified catalyst (trade) so as to attain the aim, the introduction of the CU protocol has had a role, especially on the elimination of NTBs • But is it managing fully to combat the problem of NTBs in the region? The statement by the Director General Customs and Trade in EAC: More efforts still needs to be done
Recommendations Apart from just combating the NTBs, the region has to address the following in order to improve the trade performance: • Improvement of the physical infrastructure in the region (roads, railways, airways, communication) • Education on traders/businessmen on how to manage and improve their businesses • Informal trade: hence the region can see ways on how to harmonize domestic laws and regulation, tax systems so as to reduce this form of trade