Download
1 / 6
60 likes | 119 Views
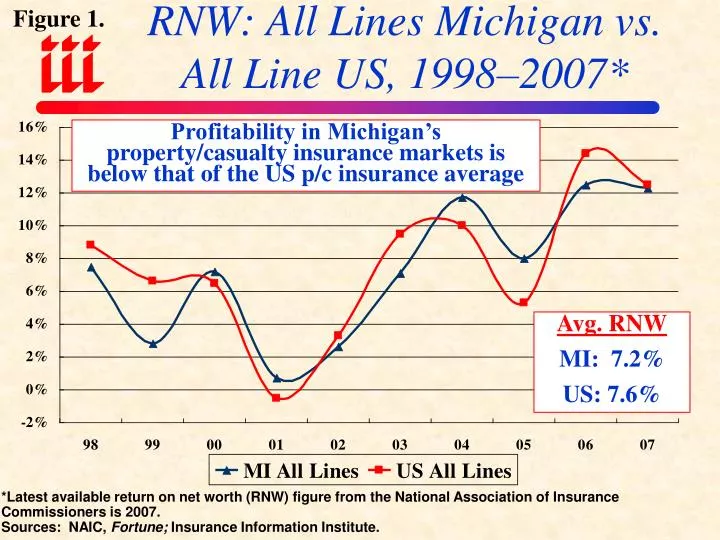
RNW: All Lines Michigan vs. All Line US, 1998–2007*. Figure 1. Profitability in Michigan’s property/casualty insurance markets is below that of the US p/c insurance average. Avg. RNW MI: 7.2% US: 7.6%.

E N D
RNW: All Lines Michigan vs. All Line US, 1998–2007* Figure 1. Profitability in Michigan’s property/casualty insurance markets is below that of the US p/c insurance average Avg. RNW MI: 7.2% US: 7.6% *Latest available return on net worth (RNW) figure from the National Association of Insurance Commissioners is 2007. Sources: NAIC, Fortune; Insurance Information Institute.
RNW: Michigan All Lines vs. Fortune 500, 1998–2007* Figure 2. Avg. RNW MI: 7.2% US: 13.6% Profitability in Michigan’s property/casualty insurance markets is barely half that of the Fortune 500 benchmark *Latest available return on net worth (RNW) figure from the National Association of Insurance Commissioners is 2007. Sources: NAIC, Fortune; Insurance Information Institute.
RNW: Michigan Pvt. Pass. Auto vs. US Pvt. Pass. Auto, 1998-2007* Figure 3. Avg. RNW MI: 2.1% US: 8.4% Profitability in Michigan’s auto insurance market—at just 2.1%--is just 1/4 that of the US average *Latest available return on net worth (RNW) figure from the National Association of Insurance Commissioners is 2007. Sources: NAIC, Fortune; Insurance Information Institute.
Figure 4. Michigan Auto RNW vs. 10-Year US Treasury Yield, 1998-2007* The average return experienced by Michigan’s auto insurers is less than half that of a risk-free investment in 10-year US Treasury securities. MI’s auto insurance market is not risk free. Percent Avg. RNW MI: 2.1% US: 4.9% *Latest available return on net worth (RNW) figure from the NAIC is 2007. Sources: NAIC, Federal Reserve;Insurance Information Institute.
Figure 5. Average Auto Insurance ExpenditureMichigan vs. US, 2000-2007* *Latest available data from the National Association of Insurance Commissioners is for 2007. Sources: NAIC; Insurance Information Institute.
Consumer Price Index for Medical Care vs. All Items, 1960-2008 Figure 6. (Base: 1982-84=100) Inflation for Medical Care has been surging ahead of general inflation (CPI) for 25 years. Since 1982-84, the cost of medical care has more than tripled Soaring medical inflation is a major driver of cost in Michigan no-fault auto insurance claims, with no end in sight. Source: Department of Labor (Bureau of Labor Statistics; Insurance Information Institute.