Download
1 / 22
220 likes | 389 Views
MACOORA. Mid-Atlantic Coastal Ocean Observing Regional Association. Outline. Survey Web sites (urls) Data and data streams Audiences Challenges Focus Areas Logo Tag Line Preferences. Survey: Ocean Information Products for Users. Survey created Oct. 10, 2008 and closed Jan. 6, 2009

E N D
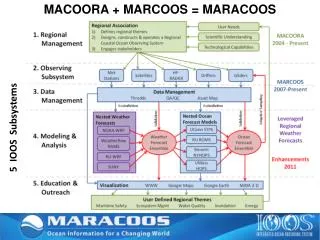
MACOORA Mid-Atlantic Coastal Ocean Observing Regional Association
Outline • Survey • Web sites (urls) • Data and data streams • Audiences • Challenges • Focus Areas • Logo • Tag Line Preferences
Survey: Ocean Information Products for Users • Survey created Oct. 10, 2008 and closed Jan. 6, 2009 • 46 respondents answered at least one question • Approximately 50% of respondents completed most questions • Analysis notes “skipped” or “blank” questions
Survey: web sites • Do you currently have a web site(s) that serves ocean observing system information for others to use?
Survey: types of data • What kinds of ocean observing system data (from hardware, to software, to models) do you use to construct the web site(s)?
Survey: data streams • What percent of the time is the critical data and/or information used to populate your website available?
Survey: data streams • Which data streams depend on grant funding to you or your institution?
Survey: targeted users of web site(s) *Free responses were categorized after completion of survey *Top nine categories out of seventeen are shown
Survey: working with users • *25 respondents completed these questions
Survey: challenges • What user need do you think is important that is not currently being met? • Data visualization (4) • Communicating inundation risk (2) • Water quality and HABs forecasts (2) • Finer scale forecasting for recreational boating safety • User-friendly challenges
Survey: challenges • List your 3 major limitations to developing a user product web site. DO NOT include “Funding” as one of the limitations. *Free responses were categorized after completion of survey. *Categories in which Count < 3 not listed
Survey: challenges • List any challenges you have to delivering these products. • Data synthesis • Resources and time • Trained people • Continuous, sustained IOOS • Paucity of observing buoys • User understanding
Survey: Focus Areas • List web-served ocean information products that support any of the four MACOORA focus issues. *Some products listed in multiple categories
Tag Line Preferences • Ocean Information for a Changing World • Ocean Observing for Decision Making
Survey: data streams • What data streams listed earlier depend on grant funding to you and your institution and thus risk being discontinued?
Survey: data streams • Examples of reliable data streams (Excellent, 95%-100% reliable) • Examples are funded by grants to institution or other funding sources
Survey: non-academic users • Do any of the web sites listed earlier provide products for non-academics? • *17 “SKIP” responses said they did not have a web site earlier in survey