Download
1 / 30
300 likes | 313 Views
Motion. PH 338. Practice using a stopwatch. Start & Stop. Time 1 second. Stop & Reset Time 10 seconds. Stop & Reset What is the shortest amount of time you can measure?. Reset. 1. What is motion?. A way of describing how fast something is moving

E N D
Motion PH 338
Practice using a stopwatch Start & Stop Time 1 second. Stop & Reset Time 10 seconds. Stop & Reset What is the shortest amount of time you can measure? Reset
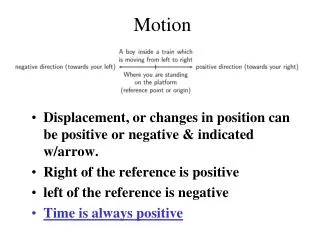
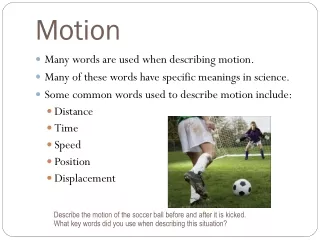
1. What is motion? • A way of describing how fast something is moving • Our definition: Motion is a change in position.
2. What is a reference point? • A point motion is measured against • Usually a stationary object
3. How do you know if an object is in motion? • An object is in motion if it changes position relative to a reference point
4. What is the difference between distance and displacement? • Distance is the total length of the actual path between two points. Displacement is the length and direction of a straight line between starting and ending points. • Displacement and distance can be the same if the direction is in one direction only.
5. What is speed? • The distance an object travels per unit of time. miles per hour miles/hour
6. How do you calculate speed? • Divide the distance the object traveled by the amount of time it takes to travel that distance.
…some useful speeds • Growing fingernails = 4 cm/year • Walking speed = 3 miles/hr or 1.3 m/s • Driving speed = 60 miles/hr or 26 m/s • Earth’s revolution = 30 km/s • Speed of light = 300,000 km/s
Road Trip! Example: The white car travels120 miles in 2 hours. What is the car’s speed? S = D S = 120 miles S = 60 miles/hour T 2 hours
7. Why would you calculate average speed? • Because most moving objects do not move at a constant speed. • Think about biking uphill and downhill
8. How do you calculate average speed? • Average speed = Total Distance Traveled Total Time of Travel
Traffic! • Example: 32 km for 2 hours, then 13 km for 1 hour Total distance = 32 km + 13 km = 45 km Total time = 2 h + 1 hr = 3 hr Average speed = 45 km ÷ 3 hr = 15 km/hr
9. What is instantaneous speed? • The rate at which an object is moving at a given instant in time. • …or what your speedometer says!
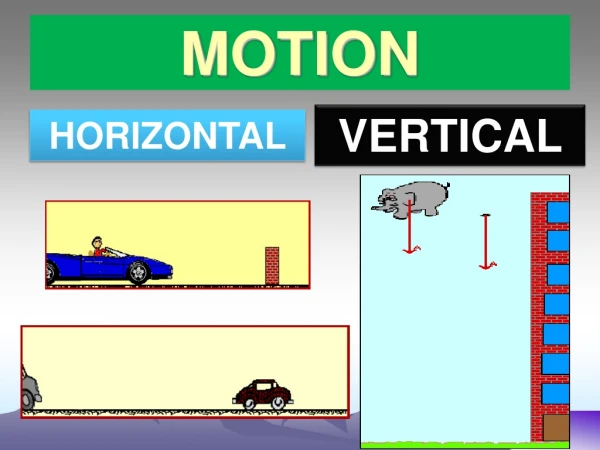
10. What is velocity? • Speed in a given direction • Ex: 20 miles/hour West A storm is moving 25 km/h north. Should you prepare?
11. How can you describe changes in velocity? • Change in velocity may be due to change in speed, change in direction, or both!
Acceleration • Acceleration is when an object speeds up, slows down or changes direction. • Acceleration is a change in velocity.
12. How do you graph speed? • By a distance versus time graph! • X-axis = time • Y-axis = distance Slope = slant of line y Distance (m) 50 X 5 Time (min)
13. How can you interpret graphs of distance versus time? • The slope represents speed • Slope = slant of line = speed! • The steeper the slope the faster the speed! Steep = Fast! Shallow = Slow!
What if it is flat? Flat = Not moving!
Speed-Time Graphs Speed-Time Graphs look much like Distance-Time graphs. Be sure to read the labels! • Time is plotted on the X-axis. • Speed or velocity is plotted on the Y-axis
A straight horizontal line on a speed-time graph means the speed is constant. This means the speed is not changing over time. How is this different from a distance-time graph?
A positive slope represents an increasing speed. The object is accelerating. speed Time
A negative slope represents a decreasing speed.The object is decelerating. Speed Time
Match the part of the graph to the description Steady acceleration ________ Steady speed _________ Gradual acceleration _________ Steady deceleration _________
Summary • The steeper the line, the greater the acceleration. • A horizontal (sunrise) line means the object is moving at a constant speed • A downward (negative) sloping line means the object is slowing down (decelerating)