Download
1 / 26
260 likes | 343 Views
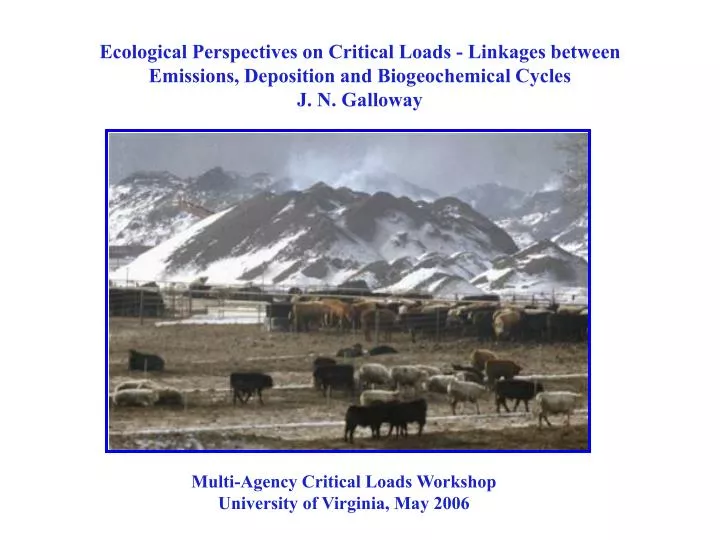
Ecological Perspectives on Critical Loads - Linkages between Emissions, Deposition and Biogeochemical Cycles J. N. Galloway. Multi-Agency Critical Loads Workshop University of Virginia, May 2006. Topics. The sulfur story Biogeochemical cycle Emissions and deposition Sulfur cascade

E N D
Ecological Perspectives on Critical Loads - Linkages between Emissions, Deposition and Biogeochemical CyclesJ. N. Galloway Multi-Agency Critical Loads Workshop University of Virginia, May 2006
Topics • The sulfur story • Biogeochemical cycle • Emissions and deposition • Sulfur cascade • The nitrogen story • Biogeochemical cycle • Emissions and deposition • Nitrogen cascade • Future considerations • Concluding thoughts
5 145 75 95 10 185 20 25 Natural Particulate Deposition Natural Gases Fossil fuel smelters Deposition Natural Particulate Natural Gases Natural Gases Land Coast Ocean Global Atmospheric S Budget, Tg S yr-1 Mackenzie, 2003 • Globally and in the USA, most of gaseous sulfur emitted is anthropogenic • Even with large scale reductions in SO2 emissions, deposition will still be elevated • over natural conditions--i.e., enhanced S deposition is here to stay.
USA SO2 Emissions1860 - 2002(million short tons/year) Natural emissions EPA, various sources • USA SO2 emissions have dropped from peak of 32 tons in 1973, to • 15 tons in 2002. The same as in 1905. • This value is still 10 times greater than the natural rate.
Wet Deposition: SO4= 1994 2004 NADP, 2006 • Decreases in SO2 emissions have resulted in decreases in S deposition. • Again, current deposition is substantially greater than the natural rate.
Total S Deposition, 2002-2004 (kg S ha-1 yr-1) EPA, NADP, CASTNeT • Both wet and dry S deposition are important • Large uncertainties in dry deposition. • Natural background, 0.4 to 0.8 kg S ha-1 yr-1
Atmosphere - increases regional haze, changes radiation balance - increases atmospheric removal rates of numerous species SOx Energy Production Terrestrial Ecosystems - stores sulfate; delays surface water acidification - H+ & Aln + acidify soil and decrease forest productivity - Ca+ +, Mg+ +, K+ losses decrease forest productivity People, Industry Human Activities - increases acidity of surface waters - causes loss of alkalinity and biodiversity The Sulfur Cascade Aquatic Ecosystems
Topics • The sulfur story • Biogeochemical cycle • Emissions and deposition • Sulfur cascade • The nitrogen story • Biogeochemical cycle • Emissions and deposition • Nitrogen cascade • Future considerations • Concluding thoughts
Nitrogen Drivers in 1860 & 1995 Grain Production Meat Production Energy Production
Nitrogen DepositionPast and Presentmg N/m2/yr 5000 2000 1000 750 500 250 100 50 25 5 1993 1860 Next, the North American Nitrogen Budget Galloway and Cowling, 2002; Galloway et al., 2002b
North American N Budget, mid 1990s (Tg N yr-1) N2 NOy fossil fuel, 7 BNF, 12 c-BNF, 6 North America fert.prod., 18 import, 5 Total Input ~48 Tg • 48 Tg N was introduced into North America, mostly as new Nr
North American N Budget, mid 1990s (Tg N yr-1) N2 NOy NHx fossil fuel, 7 4 2 3 5 BNF, 12 c-BNF, 6 North America fert.prod., 18 import, 5 Total Input ~48 Tg • 48 Tg N was introduced into North America, mostly as new Nr • 9 Tg N of NOx was emitted to atmosphere, 5 re-deposited to continent • 4 Tg N of NH3 was emitted to atmosphere, 3 re-deposited to continent
North American N Budget, mid 1990s (Tg N yr-1) N2 atm. trans., 4 atm. trans., 1 NOy NHx fossil fuel, 7 4 2 3 5 BNF, 12 c-BNF, 6 river, 7 North America fert.prod., 18 export, 8 import, 5 Total Input ~48 Tg Total Output ~20 Tg • 48 Tg N was introduced into North America, mostly as new Nr • 9 Tg N of NOx was emitted to atmosphere, 4.7 redeposited to continent • 4 Tg N of NH3 was emitted to atmosphere, 3.0 redeposited to continent • 20 Tg N in measured output; balance is either stored or denitrified.
USA NOx Emissions, 1860 - 2002(million short tons/year) Natural emissions EPA, various sources • USA NOx emissions have dropped from peak of 25 tons in 1993, to 21 tons in 2002. The same as in 1970. • This value is still 10 times greater than the natural rate.
NADP, Wet Deposition: NO3- 1994 2004 NADP, 2006 What about that other N gas?
USA NH3 Emissions, 1994 - 2002(million short tons/year) EPA, various sources • USA NH3 emissions are poorly known. • These data show a drop from 5 tons to 4 tons from 1994 to 2002.
NADP, Wet Deposition: NH4+ 1994 2004 NADP, 2006 • Wet deposition data tell a different story. • Let’s look at balance between wet and dry deposition for N species.
Total N Deposition, 2002-2004 (kg N ha-1 yr-1) EPA, NADP, CASTNeT • Both wet and dry N deposition are important • Large uncertainties in dry deposition. • Cloud N, Organic N and NH3 are missing! • Natural background, 0.8 to 1.6 kg N ha-1 yr-1
There are significant effects of Nr accumulation within the atmosphere, geosphere and biosphere • Increases in: • - tropospheric O3, N2O & PM2.5 • soil acidity and N concentrations • coastal water N concentrations • Decreases in: • - stratospheric O3 • Lead to: • loss of biodiversity in terrestrial and aquatic ecosystems • human health effects • changes in earth’s radiation balance These effects can be sequential, such that a single atom of nitrogen could contribute to them all, over time and space.
Atmosphere Galloway et al., 2003 But denitrification also produces N2O.
Nitrogen Biogeochemical Interactions Atmosphere to Forests to Headwaters to Rivers to Coastal Waters Consequences Transfers Atmosphere - increases regional haze, changes radiation balance and impacts human health - increases in tropospheric O3 & GWP; decreases in stratospheric O3 - increases/decreases GWP and decreases forest productivity NHx NOy Forests • - increases forest productivity; sequesters C in biomass • - H+ & Aln + acidify soil and decrease forest productivity • - increases tropospheric O3 & GWP; decreases in stratospheric O3 Nr Head waters - increase in acidity of surface waters; loss of alkalinity and biodiversity - increase in tropospheric O3 & GWP; decreases in stratospheric O3 Nr Rivers - increases in tropospheric O3 & GWP; decreases in stratospheric O3 Nr Coastal waters - increase in HAB, loss of biodiversity, etc - increase in tropospheric O3 & GWP; decreases in stratospheric O3 Nr Galloway et al., 2003
Topics • The sulfur story • Biogeochemical cycle • Emissions and deposition • Sulfur cascade • The nitrogen story • Biogeochemical cycle • Emissions and deposition • Nitrogen cascade • Future considerations • Concluding thoughts
Nitrogen DepositionPresent and Futuremg N/m2/yr 5000 2000 1000 750 500 250 100 50 25 5 2050 1993 USA Relevance: New sources to west and south! Galloway et al., 2004
Nitrogen DepositionPresent and Futuremg N/m2/yr 5000 2000 1000 750 500 250 100 50 25 5 2050 1993 USA Relevance: New sources to west and south! Galloway et al., 2004
Nr Creation Relative to NOx+NH3 Atmospheric Emissions 2050 1995 1860 • In 1860, 140 Tg N entered global terrestrial ecosystems; 20% was emitted to atmosphere. • By 2050, almost 3 times as much N will be introduced, 50% of which will be emitted. • The atmosphere is a growing transport medium for reactive nitrogen. • In USA, changes in agricultural mix might increase NH3 emissions. Galloway et al., 2004
Concluding Thoughts • SO2 and NOx emissions have decreased • The former is at the 1905 level. • Both are still 10-fold greater than natural rates. • Bottom line--S and N deposition are still an issue in some regions of USA. • S and N deposition is projected to increase over the next few decades • trans-boundary transport, SW and W • Limits to knowledge • NH3 emissions • Dry deposition rates • Fate of deposited N (stored or denitrified?) • Sequential impacts of N