Download

1 / 35
350 likes | 355 Views
This presentation discusses the importance of monitoring basic parameters to optimize backwash practices in package plant operations. It addresses common issues, benefits of optimization, and provides practical guidance.

E N D
Monitoring Basic Parameters Can Optimize Package Plant Operation Maine Water Utilities-Portland, ME Session 22 Wednesday, February 7, 2018
Number 1 Thank you!
Presentation is a Tribute to: • Small Package Plant in Eastern NY • Superintendent who had major concerns: • What is this system supposed to do? • What is it doing now? • How is it doing? • What does it need?
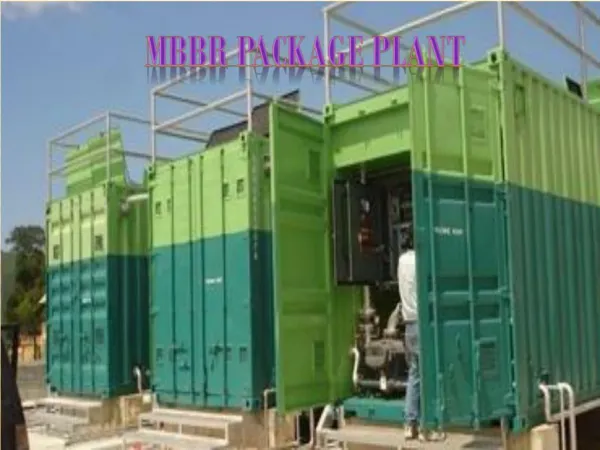
Today’s Backwash Practices • Many package plants use inefficient backwash methods. • Backwash too soon • Backwash too late • Improper chemistry • Resulting in • Increased waste • Variable effluent water quality • Inefficient operation
Wasteful Backwashing Assume 7,000 gal/flush 14,000 gal/bw 2 flushes/backwash Trident TR-420 A Ideally, 28,000 gal/cycle Prematurely, could do double ~56,000 gal/cycle To minimize waste go to terminal headloss w/o turbidity breakthrough. HEADLOSS TIME
Preferred Backwash Practices • Methods can be improved by monitoring basic parameters • to initiate a clarifier flush • to initiate a filter backwash • Based upon: • set time intervals, • head-loss across the media, • and effluent turbidity.
Benefits of Optimized Backwash Practices • The best results rely upon calibrated instrumentation • that accurately monitors these parameters • Turbidity • headloss • At the same time produce high quality effluent, • minimize waste and • increase net production. • save time and money
Basic Process ComponentsFiltering Mode Tank Washtrough CLARIFIER MEDIA FILTER MEDIA Chemistry RAW Raw Water header Underdrains Finished
Typical Package PlantCleaning step Washtrough CLARIFIER MEDIA FILTER MEDIA Waste RAW Air distributions Underdrains Backwash
Backwashing Filter on Time • Typically this set-time is measured in minutes or hours by the PLC program. • Works well when water quality stays consistent or if it is fairly stable, • flush, backwash, and downtime; occur while the demand is low.
Backwashing on Time-Concerns • Not effective when source water is variable • Increases in solids loading and can shorten clarifier and filter run times. • Flushing and backwashing based on a set-time can be costly. • If too often, more waste is produced and fill the waste storage basins or lagoons to frequently. • If too infrequently, excessive solids can spill over onto the filter. • Future flushes or backwashes limited as lagoons are too full • cleaning the lagoon is lost time and may even prevent the plant from producing usable water
Infrequent Flushing/Backwashing Concerns • Excessive solids collect in the clarifier and spill over onto the filter. Headloss increases. • Breakthrough occurs when the solids holding capacity of the clarifier media or filter media is exceeded and solids pass through the media. • In some cases, excessive headloss developed in clarifiers can damage the equipment and creating unnecessary downtime and expense for repairs. • With the filter there is the risk that effluent water quality could be impaired.
Package Plant Nuances • Fast process • Need to keep instrumentation operative • Chemistry must respond accordingly • Valves and actuators to respond quickly
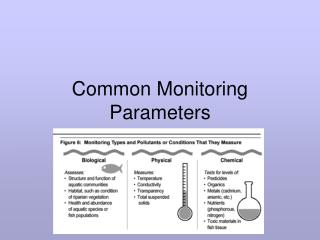
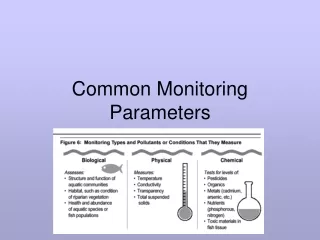
Basic Monitoring Parameters • Show how well the process is working and • Help optimizing the overall package plant • Influent turbidity • settled water turbidity or inter-stage turbidity • filtered effluent water turbidity • Headloss across the clarifier and filter • Parameters recorded either on a log sheet or continuously with a plant SCADA system
Clarifier and Filter Headloss Each includes a snap switch and gauge. Could be a pressure transducer. Clarifier on left includes hi-hi alarm/shut-down
Suggestion One manufacturer suggests: • For the best characterization of the performance of the clarifier, make turbidity readings on the influent and effluent at least once per hour throughout a run. It is important to do this frequently since, under certain conditions, the removal across the clarifier can change significantly throughout a run. • The filter effluent turbidity (if not recorded continuously) should be checked frequently; as often as once every half-hour for an in-depth characterization.
Computing Solids Removal For example for the Clarifier at hour 3: (7.2- - 0.7) / 7.2 = 0.903 or 90.3% And for the filter (0.7 – 0.06) / 0.7 = 0.914 or 91.4%
Ideal Operation By reviewing the current operation of an existing water treatment plant using the parameters as noted, the best time to flush the clarifier or backwash the filter can be determined based on minimizing breakthrough.
Breakthrough • Rapid headloss build-up due to high solids loading • Items to review • Raw quality • Pretreatment • Review process
Monitoring Headloss Development Clarifier and Filter Headloss Profile
Dual Clarifier Package Plant Clarifier Influent Raw Water Clarifier Effluent Clarifier and Filter Turbidity Profile Filter Effluent
How long to flush or backwash? • During a flush or backwash • Once process started • Take a grab sample from the waste trough every minute • Go to lab and measure turbidity • Make a graph turbidity versus time
Waste Washout Curve • Be aware solids loading changes with changing influent water quality. • Use as a seasonal reference • Can save you waste produced • Can improve clarifier and or filter run time • Improvements in clarification and extend filter run time. • Basic Parameter measured…… Turbidity!
Optimization • Consider adjusting the time between clarifier flushes and filter backwashes. This can be done in most of the PLC programs. • In conjunction with the time adjustments, adjust the headloss switches used to initiate the clarifier flush and filter backwash. This can be done by adjusting the switch settings. • Review the percent solids removed in both the clarifier and filter that can uncover which process has more room for adjustment.
Optimization (continued) • Consider modifying the dosage or type of coagulant or polymer being used. Consult with your chemical supplier who can conduct on site jar testing of various options. • Consider cleaning or replacing the media. Media analysis can be conducted by the manufacture or media supplier to determine if the media is worn or contaminated. • Keep various turbidity and headloss profiles based on seasonal operations to check the impact of changing coagulant or polymer dosages. • In all cases, before making any major change to your full scale operations, contact your local regulators or rural water association..
Fort Bragg, CA • Heath Daniels Lead Treatment Plant Operator – Water of Fort Bragg, CA. • Heath adjusted the filter pressure settings and was able to extend his filter run length from 1924 minutes to 2632 minutes. (11.8 hrs) • That’s a 37% increase in filter run time for Fort Bragg. • For California, especially during drought conditions, this is a major improvement.
Conclusions • Optimizing operations will save days of potential backwash time and money on an annual basis. • Operators must be focused on calibrating the instrumentation, properly operating the equipment, and periodically checking performance to ensure optimized operation. • Changing water quality or chemistry can upset the process and system may need to run a performance test. • The breakthrough point can be directly associated with clarifier and filter headloss. The goal is to get as close to the breakthrough point as possible without exceeding it.
Conclusions • Maximizing solids holding capacity is paramount to understanding the optimal performance of the package plant. • Optimizing the process to operate with less frequent clarifier flushing and filter backwashing can reduce waste water production • Keeping, and reviewing, results of multiple tests are useful to optimizing the system’s performance on a long term basis. • This test is independent of clarifier types, filter media types, underdrains system, or backwashing techniques. • Consult with the manufacturer for additional thoughts and suggestions on how to further optimize the process.
Food for thought: What do you do for a living?
For Additional Information • Local Contact: • David F. Sullivan & Associates, Inc. • Phone (603) 474-2484 email: info@davidfsullivan.com • Brochure • WesTech Engineering, Inc: • Matt Williams-RSM -Richard Ross-RPM • Phone: 801-803-4912 -Phone: 443-255-5973 • Email: mwilliams@westech-inc.com -Email: rross@westech-inc.com
Monitoring Basic Parameters Can Optimize Package Plant Operation Maine Water Utilities-Portland, ME Session 22 Wednesday February 7, 2018