Download
1 / 4
40 likes | 124 Views
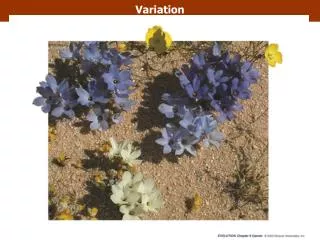
Manufacturing Variation. Plotting a Normal Distribution. Variation is inherent. Plotting variation gives a Normal distribution or Gaussian distribution or Bell Curve. Normal distribution. Most values are clustered around the Mean Some values are deviated: spread out.

E N D
Manufacturing Variation Plotting a Normal Distribution
Variation is inherent • Plotting variation gives a Normal distribution or Gaussian distribution or Bell Curve
Normal distribution • Most values are clustered around the Mean • Some values are deviated: spread out. Measure of this deviation is a number called Standard Deviation . • 68 % of data are within 1 • 95 % of data points are within 2 • 99.7 % of data points are within 3
Histogram in Excel • Prepare the “bin” range: divide data into buckets. • Add-in the Data analysis and select Histogram • Select the input data, bin data and output column • Format plot according to writing guidelines. • Find average and Standard Deviation of data. • Submit a Memo for the above.