Download
1 / 64
640 likes | 802 Views
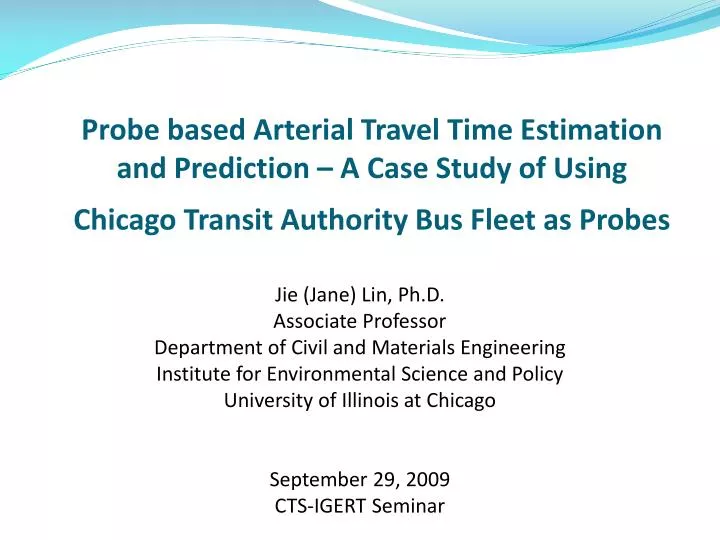
Probe based Arterial Travel Time Estimation and Prediction – A Case Study of Using Chicago Transit Authority Bus Fleet as Probes. Jie (Jane) Lin, Ph.D. Associate Professor Department of Civil and Materials Engineering Institute for Environmental Science and Policy

E N D
Probe based Arterial Travel Time Estimation and Prediction – A Case Study of Using Chicago Transit Authority Bus Fleet as Probes Jie (Jane) Lin, Ph.D. Associate Professor Department of Civil and Materials Engineering Institute for Environmental Science and Policy University of Illinois at Chicago September 29, 2009 CTS-IGERT Seminar
National ITS Architecture Source: RITA, U.S. DOT
ITS Applications • Type of applications • Advanced Traffic Management System (ATMS) • Advanced Traveler’s Information System (ATIS) • Area of applications • Freeway • Highway • Arterial/Urban streets
Classification of Applications Source: RITA, U.S. DOT
The Focus of Today’s Talk • Is travel time estimation and prediction. • Travel time data collection/sources • Traffic sensors, e.g., inductive loop detector • Floating car method/probe vehicle • Cell phone signals
Estimation Prediction Instantaneous prediction Short-term prediction Long-term prediction Space Travel time Travel time Travel time Travel time Known traffic conditions Unknown traffic conditions Past Now 1 hour Future time Travel Time Estimation and Prediction
Travel Time Prediction Source: Vlahogianni et al. 2004
Performance of Forecasting Models Source: You and Kim, 2003 Historical Profile Approach Time Series Analysis
Urban Arterial Travel Time Prediction • Largely in void because of the challenging nature • Complex urban traffic environment • Lack of continuous traffic data/measurements • Most existing applications are focused in the area of ATMS rather than ATIS • Qualitative versus quantitative measures • Other traffic parameters
Bus Probe Based Arterial Travel Time Estimation and Prediction • Research Questions • Can real-time AVL bus data be used to identify any form of interaction (or relation) between buses and cars in a traffic stream on a signalized urban street? If yes, what is the best way to quantify that? • Is it possible to use real-time incoming bus data to derive concurrent car travel time in recurring or non-recurring traffic conditions? • Is it possible to use bus probes to forecast future car travel time?
Findings in Bus Probe Literature • Limited research effort – 6 bus probe studies • Buses can be probe vehicles. • On freeway and suburban highway: Real-time AVL buses are used as complementary speed sensors reporting real-time speeds in King County, WA. • On urban street: Statistically significant relationships between archived AVL buses and general vehicles were identified. • Bus stop dwell time is the most significant noise and should be excluded in directly relating bus travel time to general vehicle travel time. • Linear regression is a common method in quantifying bus-car relationship.
Historical bus travel Real-time bus travel Predicted bus travel Historical relationships Historical car travel Real-time car travel Predicted car travel Past Now Future Travel Time Prediction Framework Future prediction: short-term (15 min) and long term (>1 hr) Historic estimation Instantaneous prediction
Type of Input Data: Archived AVL vs. Real-time AVL • Real-time AVL data was used in the study
Archived versus Real-time AVL (a) Archive AVL (b) Real-time AVL
Travel Time versus Speed as Predictor In Real-time Bus AVL: Poll during a bus trip Intrinsic measurement errors In addition, no stop dwell time is available in real-time AVL
Data Collection • Bus: real-time AVL data from Route #20 (Madison) covering about 4 months from June 1st – September 19th, 2007. • Car: GPS-equipped test vehicle data covering 9 weekdays (September 4th – 14th, 2007), 2 hours a day (10:30am – 11:30am, 5:30pm-6:30pm). The GPS records car speed, location and time every 0.1 seconds. • Street configuration. • Bus stop configuration. • Intersection control strategy .
Historical bus travel Real-time bus travel Predicted bus travel Historical relationship Historical car travel Real-time car travel Predicted car travel Past Now Future Part I: Building Historical Bus–Car Relationship – base model
EB Spatial Profiles of Bus and Car Speeds
Heuristic Engineering Segmentation Total: EB 29 links + WB 29 links
Three Forecasting Models Applied • Were tried and compared: • Multiple linear regression • 2-hour aggregate model • 1-hour aggregate models • 15-minute models • Seemingly unrelated regression • 2-hour aggregate model • 1-hour aggregate models • 15-minute models • State-space model
(i) Multiple Linear Regression (MLR) y = Xβ + ε
(ii) Seemingly Unrelated Regression (SUR) yc = Xcβc + εc • yc is car speed, is ybbus speed, Xc and Xbare explanatory variables. • Xc and Xbmay not sufficiently explain the variations and some common factors that affect both car speed and bus speed may be omitted. Thus the errors can be correlated. • The SUR model and the associated generalized least square (GLS) estimation will take the correlations among the errors into consideration and may produce better results. yb = Xbβb + εb
(iii) State Space Model • In essence, SSM uses the observed trajectory of one object to predict the unknown states of the same or a different object
VAR Smallest AIC? I (Determine state vector z) Canonical correlation analysis Significant correlation? State vector z II State equation estimation (F, G, Σ) III Estimates of Z Estimation zt could be: , , , etc.
Data used in SSM • Spatial unit: equal-distance link (10ft, 150ft or 300ft) in each direction respectively. • Temporal unit: average link speed, of 2 hour, 1 hour, and 15 minutes of the nine weekdays. • Stationarity is checked first; if nonstationary, differencing of the original data series is used.
Findings • Statistically significant relationships between bus and car speeds exist. • The variations of the difference between bus and car speeds can be largely explained by two location dummy variables: “bus-stop-only” and “signal-controlled intersection”. • The SUR model did not gain much efficiency over OLS models. Nonetheless, SUR is a good method to check the correlations among errors. • The most accurate travel time estimation is obtained by using state space models.
Historical bus travel Real-time bus travel Predicted bus travel Historical relationships Historical car travel Real-time car travel Predicted car travel Past Now Future Part II: Real-Time Travel Time Prediction
Approach • Linear model • State space model Linear bus-car relationship Updated bus speed Concurrent car speed Updated bus speed State space model Concurrent car speed Historical car speed
Historical database Confidence interval (C.I.) Is b in the C.I.? Yes New bus speed (b) Historical mean No Bayesian updating Bus Speed Updating
Historical bus travel Real-time bus travel Predicted bus travel Historical relationships Historical car travel Real-time car travel Predicted car travel Past Now Future Part III: Short-Term Travel Time Prediction
Approach Step 1. Bus speed prediction (State Space Model) Updating --> forecasting --> updating Step 2. Car speed prediction (linear regression) using predicted bus speeds
Car Travel Time Prediction Eastbound, September 11th Westbound, September 11th Eastbound, September 12th Westbound, September 12th
Eastbound, September 13th Westbound, September 13th Eastbound, September 14th Westbound, September 14th
Bus Probe Micro-Simulation Study • Three scenarios: • Drastic increase in traffic demand • Road block due to traffic incident. • Drastic increase in bus ridership along the route