Download
1 / 12
120 likes | 255 Views
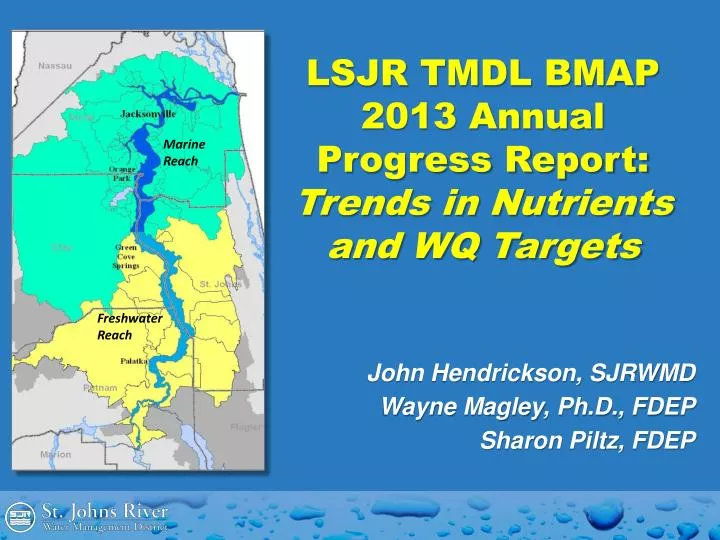
Marine Reach. LSJR TMDL BMAP 2013 Annual Progress Report: Trends in Nutrients and WQ Targets. Freshwater Reach. John Hendrickson, SJRWMD Wayne Magley, Ph.D., FDEP Sharon Piltz, FDEP. Dissolved Oxygen Monitoring Stations. LSJR Mainstem BMAP Monitoring Approach & Objectives. Talleyrand.

E N D
Marine Reach LSJR TMDL BMAP 2013 Annual Progress Report:Trends in Nutrients and WQ Targets Freshwater Reach John Hendrickson, SJRWMD Wayne Magley, Ph.D., FDEP Sharon Piltz, FDEP
Dissolved Oxygen Monitoring Stations LSJR Mainstem BMAP Monitoring Approach & Objectives Talleyrand FDEP USGS Dames Pt. • Combine interagency & multi-platform data to describe river condition, processes • Assess river water quality trends, processes, and targets achievement • Maintain ongoing data acquisition for future WQ model applications and adaptive management Long-Term River Monitoring WBID 2213K Racy Pt. Dancy Pt. Whetstone Pt. WBID 2213L
The Q Half of Load, 2013 Black Creek Flooding - Photo from Florida Times Union - Jacksonville.com
Marine Interface 5/20 LSJR 2013 Bloom Piney Pt. Mandarin Pt. Hibernia Pt. Marine Interface 4/28 Hibernia Pt. 8/12/13 Shands Pier Ramp 10/1/2013 SE Doctor’s Lake, 10/1/2013
LSJR Upstream and Freshwater Reach Nutrient Trends 1995 - 2013 Racy Pt (WBID K) 2013 Mean = 0.056 mg/L 2013 Mean = 1.15 mg/L 2013 Mean = 1.18 mg/L 2013 Mean = 0.088 mg/L
St. Johns River Longitudinal N and P Trend SJRWMD Status and Trends 2013 Report
LSJR TMDL Freshwater Reach Chlorophyll-a 40/40 Target Compliance
Marine Reach Nutrient Trends Assessed at RM 17 (WBID D)
Trends in LSJR Oligohaline Chlorophyll-a, N and P Piney Pt. TN TP N:P Mandarin Pt. Hibernia Pt. *Research suggests that blue-greens thrive under low N:P ratios
Trends in Marine Reach Dissolved Oxygen USGS Continuous Monitoring Station at Dames Point
LSJR Marine Reach Dissolved Oxygen Target Compliance Dissolved Oxygen Monitoring Stations FDEP USGS Dames Pt. • Since 2008, no exceedences of the marine reach DO criteria • Format of LSJR DO criteria now adopted as State-wide Estuarine criteria
LSJR Indicators of Eutrophication Post-TMDLWhat DoTrends Indicate? • Downward trends in N, P (under low flow) and chlorophyll-a, and increase in D.O., concur with TMDL findings and demonstrate effectiveness of nutrient load reduction in improving WQ • Divergence in flow condition trends consistent with point source reduction exceeding nonpoint reduction • Effect of recent meteorological conditions on the proportions of point and NPS load has moved FW worst-case WBID downstream, may be altering the composition of algae blooms