Download
1 / 15
160 likes | 304 Views
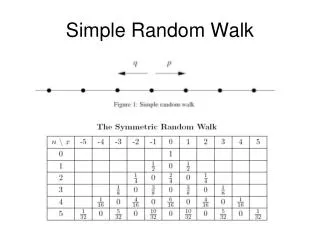
Random Walk Simulation. A “random walker” takes follows a path each step of which is chosen at random. A random walk is a model for Brownian motion. And diffusion.

E N D
Random Walk Simulation CSC 152
A “random walker” takes follows a path each step of which is chosen at random. CSC 152
And diffusion CSC 152
Set up for your simulation in Excel. If you type Sample 1 and Sample 2 in consecutive cells, highlight them and drag, Excel will update to Sample 3, etc. Make 100 samples. CSC 152
Enter the numbers 0, 1, …, 50 in the “number of steps” column. Also enter 0’s for the initial position of all 50 samples. CSC 152
Enter the formula like =F2+RANDBETWEEN(-1,1). The possible results of RANDBETWEEN(-1,1) are -1 which we will interpret as a taking a step to the left, a 0 which we will interpret as staying in place, and +1 which we will interpret as taking a step to the right. CSC 152
Copy the formula over to all of the sample column (it was column DA in the example below). CSC 152
The average over the samples should be close to zero because samples are as likely to move to the left as to the right. Therefore we look at standard deviation. Enter the formula to calculate the standard deviation of position over the various samples. Then copy that formula down over the various “times” (number of steps). CSC 152
Highlight the data (EXCLUDING the first point 0,0) and make an XY-Scatter CSC 152
Choose layout #9. Choose a Power-Law fit (Trendline). Label the axes. Add a title. CSC 152
Compare to theory • According to theory the standard deviation should have a power of ½. • How close was your value to this prediction? • What do you think you could do to improve your results? CSC 152
Extrapolation • Use your formula to estimate the standard deviation after 100 steps. CSC 152
Calculate the skewness and kurtosis of the various samples. Then copy the formula down for the various times. This is another one of those situations which should eventually have a normal distribution. CSC 152