Download
1 / 118
1.2k likes | 1.41k Views
Malthusian Neocolonialism ~ ~ ~ ~ ~ ~ ~ ~ ~ ~ ~ ~ ~ ~. A reflection on the persistent Western concern with global population growth. The various theories of human population growth can be placed into three broad categories:. Malthusian

E N D
Malthusian Neocolonialism ~ ~ ~ ~ ~ ~ ~ ~ ~ ~ ~ ~ ~ ~ A reflection on the persistent Western concern with global population growth
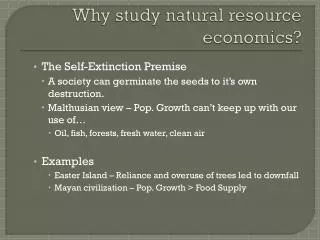
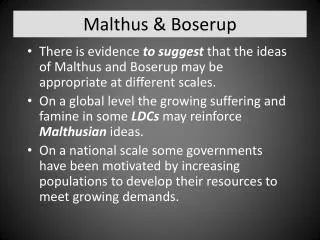
The various theories of human population growth can be placed into three broad categories: Malthusian Malthusian population theories view population as an independent variable increasing of its own volition and controlled only through an increase in mortality. (see slide 3) Neo-Malthusian Neo-Malthusian population theories, like Malthusian theories, view population as an independent variable, but argue that population growth can (and must) be controlled through a reduction in fertility. (see slide 4) Non-Malthusian Non-Malthusian population theories see population systemically as simultaneously an independent and a dependent variable, both influencing and being influenced by other variables. (see slide 5)
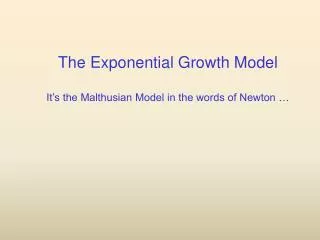
MALTHUSIANISM (population control through mortality) ⁺ POPULATION carrying capacity - TIME
NEO-MALTHUSIANISM (population control through fertility) ⁺ POPULATION carrying capacity - TIME
NON-MALTHUSIAN POPULATION ECOLOGY ⁺ carrying capacity Level of productivity Technological input Energy expenditure Labor investment Social and political organization Resources exploited Environmental impact Resource competition Fertility rate Mortality rate Cost of rearing children Labor value of children Support of elderly Infant mortality rate Demand for labor Migration ⁺ POPULATION - carrying capacity -
Malthusianism & Neo-Malthusianism Non-Malthusian Population Ecology
October 12, 1999 Y6B*Day
SOURCE: J.W. Wilmoth & P. Ball. 1992. "The Population Debate in American Popular Magazines, 1946-90." Population and Development Review 18: 640.
The Population Bomb The most prolific author promoting the issue of overpopulation has been Paul Ehrlich, with 24 articles published on the subject in popular magazines alone.
Statements made by Ehrlich . . . “The battle to feed all of humanity is over. In the 1970s and 1980s hundreds of millions will starve to death in spite of any crash programs embarked upon now.” --The Population Bomb (1968) “By 1985 enough millions will have died to reduce the earth's population to some acceptable level, like 1.5 billion people.“ --“Eco-Catastrophe” (1969)
Other Statements . . . “The population bomb threatens to create an explosion as disruptive and dangerous as an explosion of the atom, and with as much influence on prospects for progress or disaster, war or peace.” --Greissimer,Population Bomb(1954) continue. . .
“. . . No other phenomenon casts a darker shadow on the prospects for international development than the staggering growth of population.” --Pearson Report (1969) continue. . .
“. . . To put it simply: the greatest single obstacle to the economic and social advancement in the underdeveloped world is rampant population growth.” --Robert MacNamara, President World Bank (1969) continue. . .
“There are too many Asians for their own good. They have been breeding trouble for themselves --and for the world as a whole.” --J. Robbins,Too Many Asians(1959) continue. . .
“China quite literally cannot feed more people . . . The greatest tragedy that China could suffer, at the present time, would be a reduction in her death rate. . . . Millions are going to die . . . . There can be no way out. These men and women, boys and girls, must starve as tragic sacrifices on the twin alters of uncontrolled reproduction and uncontrolled abuse of the land.” --W. Vogt (1960)
Humanity was predicted to exhaust critical resources in the following order . . . gold . . . . . . . . . . . . . 1981 mercury . . . . . . . . . . 1985 tine . . . . . . . . . . . . . . 1987 zinc . . . . . . . . . . . . . . 1990 petroleum . . . . . . . . . 1992 copper . . . . . . . . . . . 1993 lead . . . . . . . . . . . . . 1993 natural gas . . . . . . . 1993 --Club of Rome, Limits to Growth (1972)
Harrison (1993) conceded that . . . “Over the past two centuries, Malthus’ basic theorem has been turned upside down. Human ingenuity has so far been able to increase world food production in line with the increase in human numbers. but argued instead that . . . “It is not a resource crisis but a pollution crisis. . . . Life may survive in some lowly form, but we may not.”
Others have also claimed that human population growth threatens the global environment. “. . . nearly one-third of the world's cropland (1.5 billion hectares) has been abandoned during the past 40 years because erosion has made it unproductive.” --Pimentel et al. (1995). “As the Worldwatch Institute has pointed out, if China's population increases by 500 million and their soil erosion continues unabated, it will need to import 200-400 million tons of food each year by 2050. . . . But by then, sufficient food imports probably will not be available on the international market.” -- Pimentel, et.al. (1996) continue . . .
“29% of the nation’s 16,000 plant species are at risk of disappearing forever.” --Mark W. Nowak, NPG (1998) “34,000 species of plants in 200 countries threatened with extinction.” --World Conservation Union (1998) 70% of the biologists polled believe a mass extinction is already underway and that up to 20% of all living species could disappear within the next 30 years due to human activity. --J. Warrick, Washington Post(1998)
The following claims of species loss have already been made . . . 40,000 species per year --Norman Myers, The Sinking Ark (1979) 250,000 species per year, with half the earth’s species gone by the year --Paul Ehrlich (1981) 2000, and all species gone by 2025. 40,000 species per year --Al Gore, Earth in the Balance (1992) 27,000 - 100,000 species per year --E.O. Wilson, Diversity of Life (1992)
Population growth is also seen as the ultimate cause of “global warming”.
Even our social problems are viewed as a consequence of population growth. “As population growth in our cities has increased, so have crime and competition for housing. As a result, Americans have taken to the suburbs to find cheaper housing and to regain open space and solitude.” --Mark W. Nowak,NPG(1998)
“You tell me. Is the world in 2000 more crowded, more polluted, less stable economically and more vulnerable to disruption than the world in 1980? The answer has to be yes.” --John Weeks, Population: An Introduction to Concepts and Issues (2000) The whole literature has the feel of . . .
Population Growth and Economic Development
“. . . millions of dollars spent on empirical research have failed to provide convincing support for the view that population growth is an obstacle to economic development.” --Frank Furedi, Population and Development (1997)
“The specialist literature exhibits a profound tension between the intuition that population growth has negative consequences for the living standards of developing societies, and the absence of empirical evidence to substantiate this sentiment. . . . when it comes to deciding on the impact of population growth, ‘feelings’ still tend to account for more than facts. ” --Frank Furedi,Population and Development(1997)
Would Ehrlich have had the same reaction and felt the same way about overpopulation if he were walking down Fifth Avenue in New York, rather than through the hot sweltering slums of Delhi?
Would Ehrlich have reacted the same way while walking through downtown Tokyo? . . . . . . or taking the Tokyo subway?
“No statistical association …(exists)… between national rates of population growth and growth rates of income per capita.” --National Research Council (1986)
Average global caloric consumption has steadily increased over the past 40 years . . . * * * . .. during the same period that world population more than doubled. SOURCE: FAO 2001 presented in Lomborg 2002:109)
SOURCE: IMF 2001 presented in Lomborg 2002:62) Food today cost less than one-third of what it cost in the 1950s.
U.S. Population Growth YearU.S. PopulationIncrease 1800 5,000,000 - - - 1900 75,000,000 1,400 % 2000 280,000,000273 %
U.S. Population Growth • Only about 3% of the population growth in the U.S. throughout the 17th and 18th centuries is attributed to immigration. • The crude birth rate in the U.S. at that time was 55 births per 1000 population, comparable to the highest national birth rates in the world today, causing the U.S. population to double every 25 years. • During the 19th century, the U.S. population grew even faster: from about 5 million in 1800 to 75 million in 1900(1400%) • The U.S. population continued to increase from 75 million in 1900 and to nearly 280 million in 2000. (280%) • 5. Although contemporary American birth rates are low, the U.S. still maintains one of the highest population growth rates in the world --comparable to those of Zimbabwe and Thailand.
New England vs. the American South • New England has historically had much higher birth rates and population growth rates than the southern U.S. • In the 17th century, New England was characterized by especially high birth rates. • In one sample of 90 families, an average of 7-8 children per family grew to adulthood, compared to only 2-3 children in the South. • Birth rates in New England during the 17th century were as high --and in some cases higher-- than birth rates in contemporary Africa, where the highest birth rates presently exist. • Yet, throughout American history, New Englanders have maintained, on average, a higher standard of living than Southerners and, indeed, among the highest standard of living in the entire U.S.
Japanese Rice Production A.D. 600 - 2000 * * * * * Compared to Other Asian Countries Today
Population Population Land Area Density (sq.mi.)(per sq.mi.) ____________________________________________________ Japan128 mil. 145,374 880 California33 mil. 155,973 211 U.S.278 mil. 3,717,780 75 ____________________________________________________
The majority of land surface in Japan is covered with forests.
In Japan, it is as if half the population of the U.S. lived in southern California.
Western Image of Africa . . . . . . and other developing countries Common terms used: “Population Bomb” * * * “Teeming Masses”
Country ______ Total Population(in thousands, 1999) _____________ Population Density(per square km., 1997) ______________ GDP Per Capita(US$, 1997) __________ Energy Consumption Per Capita(kilograms oil equiv., 1990-99) _____________ France 58,886 106 23,843 3,918 Germany 82,177 230 25,468 4,086 Italy 57,343 191 19,962 2,817 Japan 126,505 333 33,265 3,658 Netherlands 15,735 376 23,270 5,622 U.K. 58,744 240 21,921 3,938 U.S. 276,219 29 28,789 8,040 Developed Countries ______________________________________________________ SOURCE: United Nations
Country _________ Total Population(in thousands, 1999) _____________ Population Density(per square km., 1997) ____________ GDP Per Capita(US$, 1997) ____________ Energy Consumption Per Capita(kilograms oil equiv., 1990-99) __________________ Ethiopia 61,095 54 104 287 Kenya 29,549 57 356 494 Nigeria 108,945 128 1,376 753 Sierra Leone 4,717 62 260 -- Sudan 28,882 11 59 -- Uganda 21,143 85 313 -- Congo 50,336 20 52 311 Underdeveloped Countries ______________________________________________________ SOURCE: United Nations
Annual Per Capita Fresh Water Withdrawals by Country (in cubic meters , 1987-1997) Developed CountriesDeveloping Countries United States 1,677 Ethiopia 50 Japan 735 Kenya 87 U.K. 160 Nigeria 46 Germany 583 Sierra Leone 98 Italy 1,005 Sudan 669 Canada 1,623 Uganda 20 France 700 Congo 8 ____________________________________________________ SOURCE: World Resources Institute
Population density in Germany or Great Britain is: --twicethat of Nigeria --5 times that of Ethiopia or Kenya --30 times that of the Congo! Yet, it is the African countries that are considered “overpopulated” . . .
Per capita energy consumption in Germany and Great Britain is: --8 timesthat in Kenya --14 timesthat in Ethiopia! . . . Yet, it is population growth in the Africa that is seen as a threat to the global environment.
Per capita energy consumption in the U.S. is . . . --3 timesthat of Germany or Great Britain --16 timesthat of Kenya or Nigeria --28 timesthat of Ethiopia! Total U.S. Energy consumption could support . . . --4.5billionKenyans or Nigerians --7 billion Congolese --8 billionEthiopians!