Download
1 / 15
150 likes | 153 Views
This research study conducted by Melissa Martin and Julia Jones from Oregon State University uses multivariate techniques to model storm hydrographs in the HJA Experimental Forest. The study compares peak discharge and precipitation for different storm events and examines the relationship between hydrograph variables and intensity/timing of precipitation. Principal Component Analysis (PCA) is used to analyze the data and identify key variables. The research also discusses areas for future study and includes references to relevant sources.

E N D
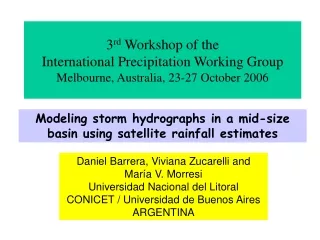
Multivariate Techniques for Modeling Storm Hydrographs in the HJA Experimental Forest Melissa Martin and Julia Jones, PhD. Oregon State University
Objectives • Compare peak discharge and precipitation for WR, DR, WRS events for each watershed • Examine relationship of hydrograph variables to intensity/timing of precipitation, under the three soil conditions listed above for each watershed • How are these different across the watersheds?
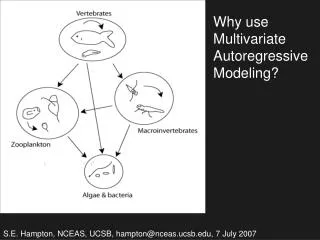
Principal Component Analysis • Why consider PCA? • What is PCA? - Explains variance-covariance structure - Good for data reduction • The ith PC is given by • Proportion of total population variance due to the kth PC is equal to
Example: PCA for WS2 • Examine the 10 hydrograph variables for normality
How many PC’s to choose? • Four PC’s are included in all principal component analyses
Normality assumptions • Not good for WS9 • Not good for WS8
Areas for future research • Statistical models: Factor analysis, two-way MANOVA, blocking, restricted date ranges, PCA regression • Hydrograph properties: Getting more storm events for WS8 (GetPQ), creating software for HJA
References • Slide 1: Photograph courtesy of Julia Jones. • Slide 3: HJ Andrews Experimental Forest figure from Perkins and Jones, Snow and physiographic controls, 1997. - Information about the watersheds and event classification: Perkins and Jones, Snow and physiographic controls, 1997. • Slide 4: Hydrograph figure from Perkins and Jones, Snow and physiographic controls, 1997. • Slide 6: The result quoted is Result 8.1, found in Johnson, Richard A. and Wichern, Dean W. Applied Multivariate Statistical Analysis, 2002. Fifth edition, Prentice Hall, Upper Saddle River, New Jersey. Page 428.
Thank You • Desiree Tullos for creating the EISI program • Julia Jones and Tom Dietterich for mentoring help on this research project • Reed Perkins for running GetPQ to create the hydrograph data set • The entire HJA staff • Fellow EISI participants