Download
1 / 48
480 likes | 579 Views
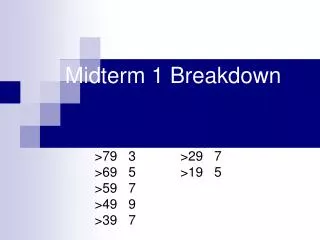
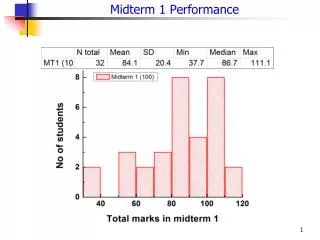
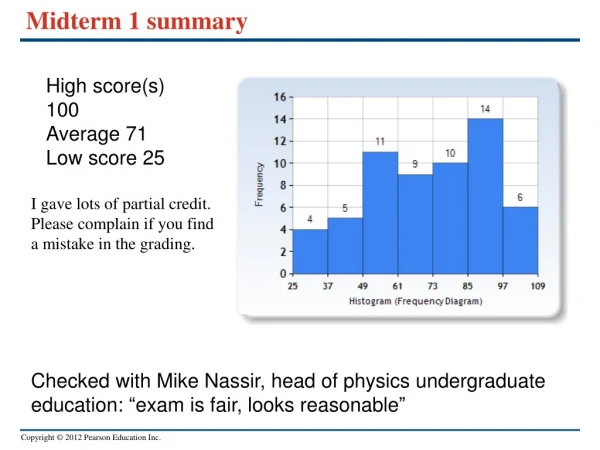
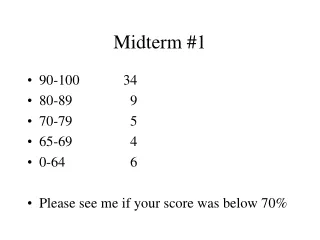
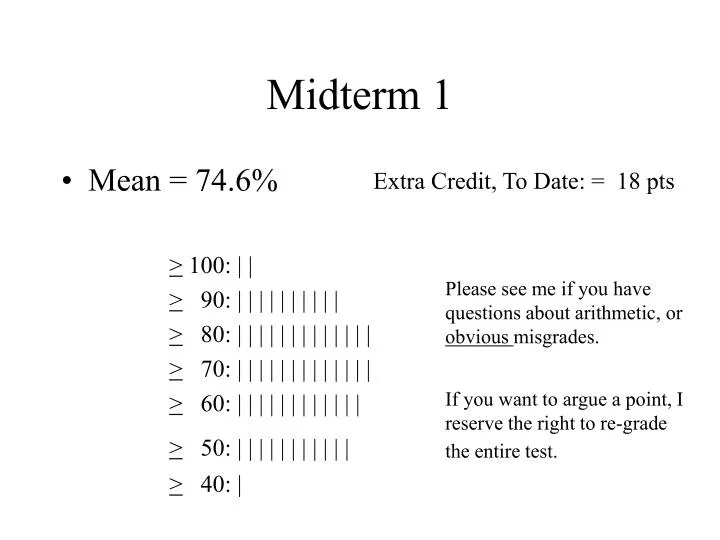
Midterm 1. Mean = 74.6% > 100: | | > 90: | | | | | | | | | | > 80: | | | | | | | | | | | | | > 70: | | | | | | | | | | | | | > 60: | | | | | | | | | | | | > 50: | | | | | | | | | | | > 40: |. Extra Credit, To Date: = 18 pts.

E N D
Midterm 1 • Mean = 74.6% > 100: | | > 90: | | | | | | | | | | > 80: | | | | | | | | | | | | | > 70: | | | | | | | | | | | | | > 60: | | | | | | | | | | | | > 50: | | | | | | | | | | | > 40: | Extra Credit, To Date: = 18 pts • Please see me if you have questions about arithmetic, or obvious misgrades. • If you want to argue a point, I reserve the right to re-grade the entire test.
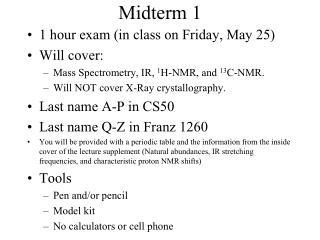
Midterm 2 • Lectures, • Assignments, • Through Chapter 5, Chromosomal Mutations.
Linkage • Genes located on the same chromosome do not recombine, • unless crossing over occurs, • The recombination frequency gives an estimate of the distance between the genes.
Recombination Frequencies • Genes that are adjacent have a recombination frequency near 0%, • Genes that are very far apart on a chromosome have a recombination frequency of 50%, • The relative distance between linked genes influences the amount of recombination observed.
? ? ? ? Linkage Ratio(How do you determine it?) Experimentally P GGWW x ggwwTestcross F1: GgWw x ggww recombinant total progeny GW Gw gW gw = Linkage Ratio
50 50 50 50 Linkage Ratio(If Sorting Independently) P GGWW x ggwwTestcross F1: GgWw x ggww 50 (Gw) + 50 (gW) 200 (all classes) GW Gw gW gw = .5
Linkage Ratio Units % = mu (map units) - or - % = cm (centimorgan)
Fly Crosses(white eyes, minature, yellow body) • In a white eyes x miniature cross, 900 of the 2,441 progeny were recombinant, yielding a map distance of 36.9 mu, • In a separate white eyes x yellow body cross, 11 of 2,205 progeny were recombinant, yielding a map distance of 0.5 mu, • When a miniature x yellow body cross was performed, 650 of 1706 flies were recombinant, yielding a map distance of 38 mu.
0.5 mu 36.9 mu y w m 38 mu Simple Mapping • white eyes x miniature = 36.9 mu, • white eyes x yellow body = 0.5 mu, • miniature x yellow body = 38 mu,
Three Point Testcross Triple Heterozygous (AaBbCc ) x Triple Homozygous Recessive (aabbcc)
Three Point Mapping Requirements • The genotype of the organism producing the gametes must be heterozygous at all three loci, • You have to be able to deduce the genotype of the gamete by looking at the phenotype of the offspring, • You must look at enough offspring so that all crossover classes are represented.
w g d Representing linked genes... W G D w g d x w g d w g d P = WwGgDd Testcross = wwggdd
w g d Representing linked genes... + + + w g d x w g d w g d P = WwGgDd Testcross = wwggdd
D- D- D- D- dd dd dd dd G- G- gg gg Phenotypic Classes W-G-D- W-G-dd W- W-gg-D W-gg-dd wwG-D- wwG-dd ww wwggD- wwggdd
# Crossovers W-G-D- 179 0 wwggdd 173 0 W G D w g d W-G-dd 46 1 wwggD- 52 1 22 1 wwG-D- W-gg-dd 22 1 W-gg-D 2 2 wwG-dd 4 2
# W-G-D- 179 Parentals wwggdd 173 W G D w g d W-G-dd 46 Recombinants 1 crossover, Region I II I wwggD- 52 22 Recombinants 1 crossover, Region II wwG-D- W-gg-dd 22 W-gg-D 2 Recombinants, double crossover wwG-dd 4
# I W-G-D- 179 Parentals wwggdd 173 W G D w g d W-G-dd 46 Recombinants 1 crossover, Region I wwggD- 52 Region I: 22 Recombinants 1 crossover, Region II wwG-D- W-gg-dd 22 46 + 52 + 2 + 4 500 x 100 W-gg-D 2 Recombinants, double crossover wwG-dd 4 = 20.8 mu Total = 500
# II 20.8 mu W-G-D- 179 Parentals wwggdd 173 W G D w g d W-G-dd 46 Recombinants 1 crossover, Region I wwggD- 52 Region II: 22 Recombinants 1 crossover, Region II wwG-D- W-gg-dd 22 22 + 22 + 2 + 4 500 x 100 W-gg-D 2 Recombinants, double crossover wwG-dd 4 = 10.0 mu Total = 500
W-gg-D 2 Recombinants, double crossover wwG-dd 4 Total = 500 10.0 mu 20.8 mu 0.1 x 0.208 = 0.0208 W G D w g d NO GOOD! 6/500 = 0.012
Interference …the affect a crossing over event has on a second crossing over event in an adjacent region of the chromatid, • (positive) interference: decreases the probability of a second crossing over, • most common in eukaryotes, • negative interference: increases the probability of a second crossing over.
Gene Order in Three Point Crosses • Find either double cross-over phenotype, based on the recombination frequencies, • Two parental alleles, and one cross over allele will be present, • The cross over allele fits in the middle...
II I A C B a c b # A-B-C- 2001 aabbcc 1786 A-B-cc 46 Which one is the odd one? aabbC- 52 aaB-cc 990 A-bb-C- 887 A-bb cc 600 aaB-C- 589
990 + 887 + 46 + 52 x 100 6951 = 28.4 mu # Region I A-B-C- 2001 aabbcc 1786 A-B-cc 46 aabbC- 52 aaB-cc 990 I A-bb-C- 887 A C B a c b A-bb cc 600 aaB-C- 589
600 + 589 + 46 + 52 x 100 6951 = 18.5 mu 18.5 mu # Region II A-B-C- 2001 aabbcc 1786 A-B-cc 46 aabbC- 52 aaB-cc 990 II 28.4 mu A-bb-C- 887 A C B a c b A-bb cc 600 aaB-C- 589
Master • Problems 1, 2 • Questions 4.1 - 4.4, 4.6 - 4.16, 4.19 - 4.20
Quantitative Traits Optional; Klug and Cummings (at the library), • Chapter 5, pp. 115 - 120, Insights and Solutions #1 (pp. 130), Questions 1-6 (pp. 131-132)
Reading Assignments Read 15.5 Available as a PDF, online. Will answer question on Monday.
Quantitative Traits …traits that show a continuous variation in phenotype over a range, …often result from multiple genes and are further termed polygenic traits.
The Club Footed Boy • Heart disease • Spina bifida • Neural tube disorders • Diabetes • Etc. Ribera, 1642
Environmental Factors Optional: Chapter 15
Discontinuous Traits • Discontinuous Traits, • exhibit only a few distinct phenotypes and can be described in a qualitative manner, • Mendel and others worked with “inbred” lines, Father: DD BB cc aa EE FF GG Mother: dd BB cc aa EE FF GG
Continuous Traits • “Outbred” transmission, Father: ddBB CC AA EE FF GG Mother: DDbb CC aa EE ff gg • Continuous Traits, • Display a spectrum of phenotypes, and must be described in quantitative terms,
F3 #1: Cross Two Individuals With 10 Cm Ears. F3 #2: Cross Two Individuals With 17 Cm Ears.
Polygenic Traits and Mendel • It is possible to provide a Mendelian explanation for continuous variation by considering numbers of genes contributing to a phenotype, • the more genes, the more phenotypic categories, • the more categories, the more the variation seems continuous.
Calculating the Number of Genes • If you know the frequency of either extreme trait, then the number of genes (n) can be calculated using the formulae… 1 4n = ratio of F2 individuals expressing either extreme phenotype.
1 4n = 1/4 show the extreme traits, 1 41 n = 1
1 4n 1 16 1 42 = = 1/16 show either extreme traits, n = 2
Continuous Variation • Two or more genes that influence the same phenotype, often in an additive way, • additive allele: contributes a set amount to the phenotype, • non-additive allele: does not contribute to the phenotype. • The affect of each allele on the phenotype is relatively small, and roughly equivalent, • Substantial variation is observed when multiple genes control a single trait, • Must be studied in large populations.
Inbred strain #1, mean height = 24 cm, • Inbred strain #2, mean height = 24 cm, • F1 mean height = 24 cm, • F2, 12 - 36 cm range, mean = 24 cm, • 4/1000 are 12 cm, smallest class • 4/1000 are 36 cm, largest class a. What mode of inheritance? b. How many gene pairs? Quantitative. 1/4n = 1/250, n = 4 4/1000 = 1/250 are the extreme class, solve 1/4n = ratio of extreme class 42 = 16, 43 = 64, 44 = 256, etc.
Inbred strain #1, mean height = 24 cm, • Inbred strain #2, mean height = 24 cm, • F1 mean height = 24 cm, • F2, 12 - 36 cm range, mean = 24 cm, • 4/1000 are 12 cm, smallest class • 4/1000 are 36 cm, largest class c. How much does each allele contribute? range: largest (36 cm) - smallest (12 cm) = 24 cm alleles: 4 genes, 8 potential additive alleles 24 cm / 8 additive alleles = 3 cm / additive allelle
P1 AABBccdd x aabbCCDD F1 AaBbCcDd x AaBbCcDd Base Height is 12 cm, so each P1, F1 has 4 additive alleles. • Inbred strain #1, mean height = 24 cm, • Inbred strain #2, mean height = 24 cm, • F1 mean height = 24 cm, • F2, 12 - 36 cm range, mean = 24 cm, • 4/1000 are 12 cm, smallest class • 4/1000 are 36 cm, largest class d. Indicate one possible set of P1, F1.