Download
1 / 65
650 likes | 763 Views
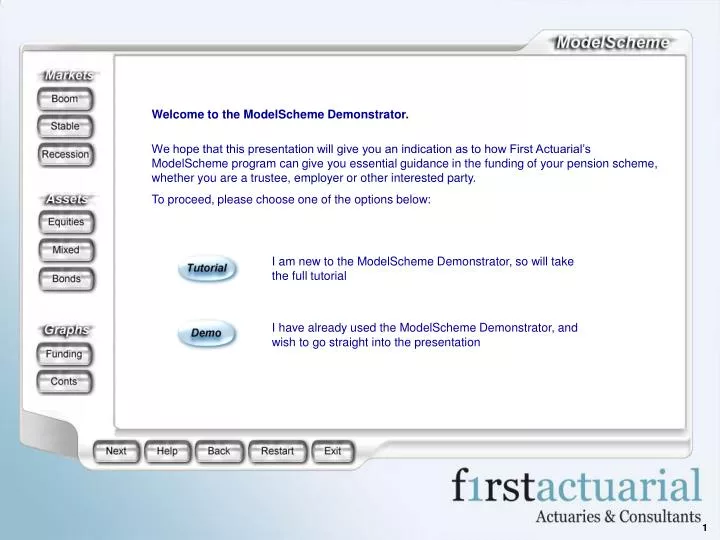
Welcome to the ModelScheme Demonstrator. We hope that this presentation will give you an indication as to how First Actuarial’s ModelScheme program can give you essential guidance in the funding of your pension scheme, whether you are a trustee, employer or other interested party.

E N D
Welcome to the ModelScheme Demonstrator. We hope that this presentation will give you an indication as to how First Actuarial’s ModelScheme program can give you essential guidance in the funding of your pension scheme, whether you are a trustee, employer or other interested party. To proceed, please choose one of the options below: I am new to the ModelScheme Demonstrator, so will take the full tutorial I have already used the ModelScheme Demonstrator, and wish to go straight into the presentation 1
ModelScheme - providing an insight into pension schemes and their costs Trustees and sponsoring employers of final salary schemes both walk a financial tightrope, and need a thorough understanding of their schemes’ finances. However, until now, it has been both difficult and expensive for employers to build pension scheme costs into their overall business plans. ModelScheme, developed by First Actuarial, is a tool that enables employers and trustees to model the finances of their pension schemes under a variety of different scenarios and thus be better informed about the financial consequences of any proposed future strategy. This interactive demonstration will show you how Model Scheme can help guide you, and prepare your scheme for the future. If at any point you feel you want more information or need assistance, click on the help button at the bottom of the screen, otherwise choose ‘Next’ to continue. 2
Trustee Knowledge & Understanding The Pensions Act 2004 has made it a requirement for Trustees to understand the laws relating to pensions and trusts, and especially the principles of funding occupational pension schemes, and the principles of the investment of scheme assets. For more information on this subject, click here Investment Strategy Clearly, it is beneficial to know more about your scheme’s investments than the minimum that the law requires. Optimising your investments will benefit both scheme members and employers, as benefits will be made more secure at a lower contribution cost. But, high return investments can also entail risks. Will your scheme be able to react to market changes? ….more Financial Planning ModelScheme provides ‘What if?’ analysis in real time, which allows you to see the impact of different funding strategies on your scheme, and whether you will be able to manage your expenses if financial conditions changes. ….more Benefit strategy Can you afford to keep your final salary scheme? Can you afford not to? Is closing your scheme to new entrants or future accrual the right thing to do, or is it not the fix its painted it to be? ….more Why do you need ModelScheme? ModelScheme gives you an insight into the interrelations between all the factors working around your scheme: 3
Based on actual scheme information ModelScheme projects forward pension costs and funding levels based on whatever set of assumptions you wish to explore. These include: Membership changes Market conditions Modifications to the scheme including changes of accrual and closing to new entrants. Actuarial Assumptions, such as mortality loadings Expenses Current scheme funding levels ModelScheme produces “real time” outputs, to allow you to make sound business decisions. The following example shows how ModelScheme can do this. What does ModelScheme do? 4
When you use ModelScheme for real, your scheme’s actual membership, funding level and status are used. For this demonstration, our sample scheme has the following features: Closed to future accrual Assets at last valuation: £5,500k Liabilities at last valuation: £8,700k Deficit at last valuation: £3,200 k Asset strategy: 50% Equities, 50% Bonds Scenario: Stable economy Rolling deficit spread method The graph over the page shows how we expect the scheme’s membership to change over time Sample Scheme 5
Total Membership 350 300 250 200 Number 150 100 50 0 2004 2005 2006 2007 2008 2009 2010 2011 2012 2013 2014 2015 2016 Year Actives Deferreds Pensioners Widows The graph above shows how each segment of the scheme’s membership will alter over time as a proportion of the whole. Note that in a closed scheme such as this, there are no active members, and the number of deferreds declines over time as members age and retire. Hover your mouse over each section of the graph for a brief explanation 6
This graph shows how the funding level of the scheme is expected to vary over time. The left hand axis shows the monetary amount of the assets and liabilities The right hand axis and yellow line show the funding level. Notice how this trends to 100% over time External forces work on the financing of pension schemes all the time, and the graph would look very different if economic conditions change. On the next page we show how the funding graph would appear if there was a recession 7
If there is an economic slump, the funding level of the scheme is reduced considerably. The depressed stock market restricts investment growth, and hence the assets of the scheme. Note also how liabilities are also constrained to a degree, as increases in prices are also limited. If this was your pension scheme, would the sponsoring employer have the financial strength to bring it back to an acceptable level of funding in case of recession? 8
During a period of economic boom, funding levels increase beyond 100%, thanks to buoyant investment returns. Would the sponsoring employer have been able to pay lower contributions at an earlier stage if her could have predicted the upturn. If this scheme was open to accrual, liabilities would have increased more due to higher wage increases. The rest of this presentation shows you how to use the ModelScheme Demonstrator and then allows you to choose various economic and investment scenarios to see how the funding of the scheme will be affected. 9
Markets The ModelScheme Demonstrator is very easy to use. First, you decide how you wish to model economic changes using the buttons on the left under the heading ‘Markets’. When using the real ModelScheme, the results from your pension Scheme’s last actuarial valuation are entered, and rolled forward to date using actual market returns. Then a number of economic assumptions for future are applied. In this simplified version, the options are: Boom The top button is economic boom this assumes that the economy with grow strongly in the future. Stable The middle button is a reasonable halfway house. Recession Choosing the bottom button models recession – that the economy will slow down in the future. For detailed information on the economic assumptions used in this example, or assistance click on the ‘Help’ button below. Otherwise: Choose ‘Stable’ 10
Next, choose the investment strategy that you wish to explore using the buttons under the heading ‘Assets’. Equities The top button assumes that the scheme is invested wholly in equities. Mixed The middle button assumes a 50/50% mix of equities and bonds Bonds The bottom assumes that bonds are the only investment medium Again, more information on the assumptions used can be accessed by clicking on the ‘Help’ button below. Otherwise: Choose ‘Mixed’ 11
Once you have made your choices, the ModelScheme Demonstrator produces a graph showing the projected funding levels of the scheme. To view the overall contribution required: Click on the ‘Conts’ button, left. 12
You have now completed the background section of the ModelScheme Demonstrator. Choose ‘restart’ to view again, or Click on the ‘Next’ button to try your own combinations of economic conditions. 13
First, please choose the economic assumption that you wish to base the model on These are the buttons on the left under the heading ‘Markets’ For full instructions about how to use the ModelScheme Demonstrator, click on the Tutorial button: 14
First, please choose the economic assumption that you wish to base the model on These are the buttons on the left under the heading ‘Markets’ Next, pick the asset allocation strategy Click on either ‘Equities’, ‘Mixed’ or ‘Bonds’ For full instructions about how to use the ModelScheme Demonstrator, click on the Tutorial button: 15
First, please choose the economic assumption that you wish to base the model on These are the buttons on the left under the heading ‘Markets’ Next, pick the asset allocation strategy Click on either ‘Equities’, ‘Mixed’ or ‘Bonds’ For full instructions about how to use the ModelScheme Demonstrator, click on the Tutorial button: 16
First, please choose the economic assumption that you wish to base the model on These are the buttons on the left under the heading ‘Markets’ Next, pick the asset allocation strategy Click on either ‘Equities’, ‘Mixed’ or ‘Bonds’ For full instructions about how to use the ModelScheme Demonstrator, click on the Tutorial button: 17
First, please choose the economic assumption that you wish to base the model on These are the buttons on the left under the heading ‘Markets’ Next, pick the asset allocation strategy Click on either ‘Equities’, ‘Mixed’ or ‘Bonds’ Finally, choose the graph that you wish to view Note that once you have made your first illustration, you can navigate directly to any of the others without restarting from the beginning, for better comparisons For full instructions about how to use the ModelScheme Demonstrator, click on the Tutorial button: 18
First, please choose the economic assumption that you wish to base the model on These are the buttons on the left under the heading ‘Markets’ Next, pick the asset allocation strategy Click on either ‘Equities’, ‘Mixed’ or ‘Bonds’ Finally, choose the graph that you wish to view Note that once you have made your first illustration, you can navigate directly to any of the others without restarting from the beginning, for better comparisons For full instructions about how to use the ModelScheme Demonstrator, click on the Tutorial button: 19
First, please choose the economic assumption that you wish to base the model on These are the buttons on the left under the heading ‘Markets’ Next, pick the asset allocation strategy Click on either ‘Equities’, ‘Mixed’ or ‘Bonds’ Finally, choose the graph that you wish to view Note that once you have made your first illustration, you can navigate directly to any of the others without restarting from the beginning, for better comparisons For full instructions about how to use the ModelScheme Demonstrator, click on the Tutorial button: 20
First, please choose the economic assumption that you wish to base the model on These are the buttons on the left under the heading ‘Markets’ Next, pick the asset allocation strategy Click on either ‘Equities’, ‘Mixed’ or ‘Bonds’ Finally, choose the graph that you wish to view Note that once you have made your first illustration, you can navigate directly to any of the others without restarting from the beginning, for better comparisons For full instructions about how to use the ModelScheme Demonstrator, click on the Tutorial button: 21
First, please choose the economic assumption that you wish to base the model on These are the buttons on the left under the heading ‘Markets’ Next, pick the asset allocation strategy Click on either ‘Equities’, ‘Mixed’ or ‘Bonds’ Finally, choose the graph that you wish to view Note that once you have made your first illustration, you can navigate directly to any of the others without restarting from the beginning, for better comparisons For full instructions about how to use the ModelScheme Demonstrator, click on the Tutorial button: 22
First, please choose the economic assumption that you wish to base the model on These are the buttons on the left under the heading ‘Markets’ Next, pick the asset allocation strategy Click on either ‘Equities’, ‘Mixed’ or ‘Bonds’ Finally, choose the graph that you wish to view Note that once you have made your first illustration, you can navigate directly to any of the others without restarting from the beginning, for better comparisons For full instructions about how to use the ModelScheme Demonstrator, click on the Tutorial button: 23
First, please choose the economic assumption that you wish to base the model on These are the buttons on the left under the heading ‘Markets’ Next, pick the asset allocation strategy Click on either ‘Equities’, ‘Mixed’ or ‘Bonds’ Finally, choose the graph that you wish to view Note that once you have made your first illustration, you can navigate directly to any of the others without restarting from the beginning, for better comparisons For full instructions about how to use the ModelScheme Demonstrator, click on the Tutorial button: 24
First, please choose the economic assumption that you wish to base the model on These are the buttons on the left under the heading ‘Markets’ Next, pick the asset allocation strategy Click on either ‘Equities’, ‘Mixed’ or ‘Bonds’ Finally, choose the graph that you wish to view Note that once you have made your first illustration, you can navigate directly to any of the others without restarting from the beginning, for better comparisons For full instructions about how to use the ModelScheme Demonstrator, click on the Tutorial button: 25
First, please choose the economic assumption that you wish to base the model on These are the buttons on the left under the heading ‘Markets’ Next, pick the asset allocation strategy Click on either ‘Equities’, ‘Mixed’ or ‘Bonds’ Finally, choose the graph that you wish to view Note that once you have made your first illustration, you can navigate directly to any of the others without restarting from the beginning, for better comparisons For full instructions about how to use the ModelScheme Demonstrator, click on the Tutorial button: 26
Best Case Scenario With the economy growing strongly, returns on the equity investments are high, and the deficit is amortized by 2008, as the scheme reaches full funding. From this point onwards, the rate of increase in the funding level reduces, as the employer is able to reduce contributions to the scheme 27
Best Case Scenario As can be seen from the funding graph, the deficit is completely paid off in 2008, and strong returns on equities mean that the employer can take a contribution holiday from 2009. In this circumstance, the employer may consider reopening the scheme to accrual, or offering some other replacement benefits to the workforce. 28
Steady Increases Over the next decade, the funding level gradually rises to 80%, as assets grow at a faster rate than liabilities. Requires contributions to the scheme remain relatively steady – click on ‘Conts’ for an illustration. 29
Steady Increases The cost of the fund oscillates slightly, but remains relatively steady at around £350k. This might represent a fairly cautious approach to investment in times of strong economic growth 30
Missed Opportunity? Despite favourable conditions, the scheme remains only 50% funded at the end of the illustration period. Asset growth is not enough to follow increasing liabilities, so there is no overall improvement in scheme’s health. 31
Missed Opportunity? Contributions increase by around a third over time, as the conservative investment strategy fails to keep pace with the economy. Compare this graph with those for alternative investment strategies. 32
Aggressive Investments The funding level of the scheme increases gently over the whole period due to the good investment returns, eventually reaching over 70%. Compare this result with both the ‘Boom’ and ‘Recession’ scenarios. 33
Aggressive Investments In this scenario, costs remain relatively stable, although there is a general increase over time. Compare this with the costs which would be incurred if other investment strategies are taken 34
Par Funding remains level at around 65%, not as impressive as the returns generated by equities, but possibly safer in the event that the economy takes a downturn 35
Par The contributions required grow slowly over the period illustrated. Compare these numbers with those found under different market assumptions 36
Too Cautious? By the end of the illustration period, the funding level of the scheme is nearly 20% lower than if equities were the chosen investments, despite additional contributions being made by the employer. This situation may be reversed should a recession strike however. 37
Too Cautious? In this scenario, the employer costs rise steadily as the return on bonds is not enough to defray the scheme costs. Compare this graph with the one illustrating equity investments. Bonds are however the ‘safe’ investments should the market take a downturn. 38
Worst Case Scenario As the recession bites, the funding level of the scheme remains stuck below 60%, despite enormous employer contributions. (See the contribution graph!) Meanwhile, the liabilities continue to grow, leaving both employer and scheme in serious financial trouble. 39
Worst Case Scenario As the markets slow, returns on investments shrink, and costs grow steadily, to over £1m annually in the coming decade. Could your company survive this? Remember, this example scheme is already closed to accrual, so it will be difficult to control costs once they start to grow out of control. ModelScheme allows the risks to be assessed and prepared for before they become realities. 40
Hard Times Not surprisingly, the asset mix has provided a degree of protection from the volatility of the equity market during the recession, but with a stronger performance by equities in times of economic stability, is the ‘safe’ middle ground of a 50/50 mix the correct strategy for your scheme 41
Hard Times As can be expected, investing in mixed assets produces a ‘middle of the road’ graph part way between equities and bonds. Remember, the Demonstrator is a much simplified version of ModelScheme. Your scheme may react differently to various economic circumstances. 42
Weathering the Storm The funding level of the scheme depressed by the struggling economy, but investing in bonds has offered a degree of protection from the worst of the market’s trouble. 43
Weathering the Storm Employer contributions rise steadily, but investing in bonds means that the company avoids the full cost of the recession which it would have had to bear had it chosen a more equity based strategy. 44
Help Click on the ‘Tutorial’ button for full instructions on how to use the ModelScheme Demonstrator: Please note that the ‘Back’ and ‘Next’ buttons at the bottom of the screen have been disabled for this section of the presentation. Use the assumptions buttons on the left of the screen to navigate directly through the demonstration. To return to the presentation, click on the ‘Restart’ button Return to Tutorial 46
Help Please choose either of the two options available: Tutorial: If you are new to the ModelScheme Demonstrator, we suggest that you should click on this choice. This provides background information on ModelScheme, plus instructions about how to use the Demonstrator. Demo: If you have already enjoyed the demonstration, and do not wish to follow the instructions again, pick this option to go directly to the scheme illustrations. Please note that the assumption buttons on the left of the screen have been disabled for the tutorial section of the presentation To return to the presentation, click on the ‘Back’ button 47
Help There is no help topic associated with this page Please note that the assumption buttons on the left of the screen have been disabled for the tutorial section of the presentation To return to the presentation, click on the ‘Back’ button 48
Help There is no help topic associated with this page. For further details regarding the information on the page, click on the links within the text Please note that the assumption buttons on the left of the screen have been disabled for the tutorial section of the presentation To return to the presentation, click on the ‘Back’ button 49
Help There is no help topic associated with this page Please note that the assumption buttons on the left of the screen have been disabled for the tutorial section of the presentation To return to the presentation, click on the ‘Back’ button 50