Download
1 / 45
450 likes | 537 Views
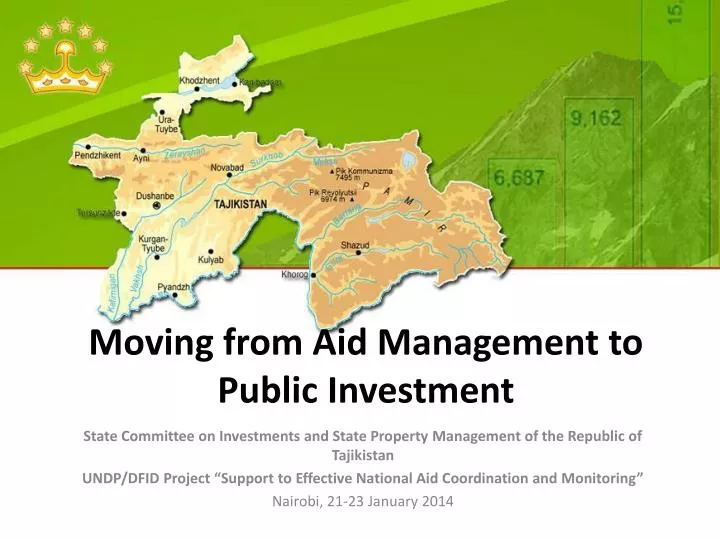
Moving from Aid Management to Public Investment. State Committee on Investments and State Property Management of the Republic of Tajikistan UNDP/DFID Project “Support to Effective National Aid Coordination and Monitoring” Nairobi , 21-23 January 2014.

E N D
Moving from Aid Management to Public Investment State Committee on Investments and State Property Management of the Republic of Tajikistan UNDP/DFID Project “Support to Effective National Aid Coordination and Monitoring” Nairobi, 21-23 January 2014
SCISPM Aid Information Management System (AIMS) In 2013 information against 446 projects was updated, including 139 incomplete projects and 324 current projects including 153 new projects. External cooperation process involves 77 development partners, including 22 bilateral, 21 multilateral, 32 non-governmental and 3 other international organizations.
Foreign Aid Trends In 2009 foreign aid reached its peak at US$ 577 mln. Over the last three years annual volume of foreign aid reduced to 33%.
Foreign aid trends per capita and share of foreign aid in GDP Over a period 2002-2012 foreign aid per capita increased from US$ 35,9 to US$ 49,8, while share of foreign aid in GDP decreased from 19% to 5%. Foreign Aid per capita Foreign Aid share to GDP
Foreign aid trends by loans and grants Foreign aid tends to decrease both in terms of loans and grants, while loan share falls more rapidly.
Donor countries assistance in 2012 In 2012 Germany provided US$ 35 mln. (25%), China – US$ 28 (20%), Japan – US$ 22 mln. (16%), Saudi Arabia – US$ 15 mln. (11%), Switzerland – US$ 14 mln. (10%), UK – US$ 11 mln. (8%), USA – US$ 6 mln. (4%), etc.
Foreign aid trends by group of international organizations Assistance from multilateral organizations over the period 2002-2009 tended to grow, but over the next few years, aid provided by the said organizations reduced and in 2012 amounted US$ 233 mln.
Disbursement structure by groups of international organizations and implementingagencies in 2012 Foreign Aid by group of international organizations The highest aid amount was disbursed PIUs totaling US$ 138 million or 36%. Ministries and departments have disbursed 109 million (28%), local NGOs - US$ 3 million (0.8%), local governments - US$ 1 million (0.3%). Aid disbursements by implementing agencies In 2012, the highest amount received from multilateral organizations totaled $ 233 million or 60% of the total aid received in 2012. Bilateral organizations’ share amounted US $ 141 million, or 36%, NGOs - $ 14 million, or 4%.
State investment projects Investment projects portfolio structure Total joint investment projects portfolio amounted US$ 2.1 billion, where US$ 1.9 billion (90.8%) was external resources, US $ 182 million (8.8 %) - Government contribution and US $ 8 million (0.4%) - other funding. For the period 2002-2012, the volume of investment funds disbursements amounted to US $ 2.3 billion or 73% of the total investment funds, considered by agreements. Investment funds disbursement for 2002-2012
ADB and WB investment projects portfolio funds disbursement as of 30 June 2013 World Bank
Foreign aid by regions In 2012 highest foreign aid rates were used to implement nationwide projects, share of which made 38,8%. 25,4% of total foreign aid was directed to Khatlon region, 14,4% - to Sughd, 10,9% to RRS, 5,4% to Dushanbe and 5,1% to GBAO.
Foreign aid per capita by regions GBAO accounts for the lowest share of foreign aid which is only 5,1% of total aid provided to Tajikistan in 2012. However, calculation of foreign aid per capita in GBAO shows US$ 94,4 which is much higher than similar measurements in other country regions.
Aid by Expenditure Categories in 2012 In 2012 aid structure by expenditure categories shows that the largest disbursement were made under the category of “Works”– US$158 mln. (41%) The “Other” category amounted US$114 mln. (29%), “Goods” – US$64 mln (17%) and “Services” – US$ 52 mln. (13%). The “Other” disbursements category included more than 73% of Sub-loan/on-lending and operational costs
ForeignAidbySector In 2012 more than ⅓ of all aid was directed to two priority infrastructure sectors: Transport (24.3%) and Energy (9.8%). About ⅓ of foreign aid used for the development of social sectors.
Foreign aid trends in social sphere sectors Over the last three years volume of foreign aid throughout all sectors tended to fall, apart from three sectors in social sphere.
Aid structure by sectors for 2010-2012 For the period of 2010-2012 the largest assistance was provided to the transport sector in the amount of US$ 406,726 thousand or 29.1% of the total aid received by the country. The smallest amount of aid was provided to the private sector and industry – US$ 33,630 thousand or 2.4 %.
Commitments and disbursement in the Private sector during 2002-2012 In 2005, the aid to private sector has reached its maximum value in the amount of US$ 15 004 thousand. In 2006-2007, the aid volumes fell sharply. In subsequent years, the trend of aid growth has been observed.
Disbursements by aid modality (loans and grants) in the Private sector during 2002-2012 For 2003-2008, the nature of aid volume in the private sector and industry is determined by the changes in the volume of loans in this sector. Since 2009, the aid to the private sector comes solely in the form of grants.
Disbursements in the Private sector by groups of international organization during 2002-2012 In recent years, an increase of aid from bilateral organizations is observed, the amount of payments of which in 2012 reached US$ 7,272 thousand, and reduction of aid from multilateral organizations, the payments of which amounted to US$ 3,345 thousand in 2012.
Number of projects in the Private sector by duration and total cost during 2002-2012 The Projects with a duration of up to 1 year account for 31.3% of the total number of projects. The Projects with a duration of 2 to 3 years account for 42.9%, 4 to 5 years duration projects - 16.3 %, and projects with a duration of more than 5 years - 9.5%. The largest share was projects worth up to US$ 50 thousand - 38.1% of the total number of projects implemented in the sector. Next projects with cost of between 50 and 500 thousand US$ - 35.4%, projects costing from 1,000 to 10,000 - 16.3%, and projects up to US$ 500-1,000 thousand - 9.5%.
Aid structure by sub-sectors of the Private sector For the period of 2010-2012, 49% of all assistance to private sector was directed to its support and development, 18.1 % of aid to support the Finance and Banking subsector, 4.3 % of aid to improve the investment climate, 1.3% for tourism development, 1% to support Microfinance.
Common Space One Strategy Poverty Reducation Strategy One Coordintion Mechanism Development Forum Action Plan One Monitoring & Evaluation Framework Common space for linking M&E framework with financing mechanisms Joint Country Partnership Startegy
Improving Regulatory Framework • Guidelines on Foreign Aid Mobilization, Management, Coordination and Monitoring in the Republic of Tajikistan; • Improvement of transparency of procurement processes; • Inserting changes to SCISPM Regulation, new structure.
PRS implementation in 2010-2012 Over the period 2010-2012 total 837 foreign aid projects have been implemented, including 336 projects or 40% of which were implemented under the PRS. During this period foreign aid volume amounted US$ 1,4 bln., 61% of which was used in accordance with PRS.
Support to sectors under the PRS 2010-2012 There is a significant difference between the total aid and the aid provided under the PRS. Especially with regard to such sectors as Government administration, where aid provided under the PRS made only 13% of total aid to this sector; Private sector and Industry - 14%, Social welfare and labour - 36%.
Total disbursements volume and disbursements under PRS in the Private sector for 2010-2012
IndicatorsoftheLivingStandardsImprovementStrategyofTajikistanfor 2013-2015 (LSIS)
Results of the discussion between the Government and DPs • Volumeofaidoverthelastfewyearstendstoreduce; • Duringthereportingperiodshareofgrantsexceededthatofloans; • Shareofaidprovidedbybilateralorganizationskeepsreducing, consequently, shareofaidfrommultilateralorganizationsgrows; • Majorityofaidisbeingimplementedbythenationalplayers (PIUs, ministriesanddepartments, localauthoriesandNGOs); • Thereisagapinimplementationofgreatamountofcommitmentsinanumberofsectors; • 205 measuresof PRS actionsmatrixfor 2010-2012 wereimplementedunder 336 foreignaidprojects; • Morethan 60% ofaidisalignedwith PRS prioritymeasuresfor 2010-2012; • Insufficientassistance, under PRS, tosuchprioritysectorsas: GovernmentAdministration, PrivateSectorandIndustryandSocialWelfareandLabour.
Recommendations • Activities on sector and regional aid coordination development • Capacity building of SCISPM and regional structures in aid coordination sphere • Further development of cooperation with development partners, including under SPC. • Participation in international Global Partnership Monitoring process • Complex works on AIMS expansion and its effective use.
Monitoring tools of the Global Partnership SCISPM Aid Information Management System (AIMS) Contains information on foreign aid flows provided to Tajikistan A tool in which the collected data provided by both the national government and development partners. Contains detailed definitions developed to assist involved countries in collecting the necessary data.
Data Collection on National Level Indicators SCISPM– National Coordinator Data collection from national participants- Indicators 6,7,9b Support Group of the Global Partnership Monitoring in Tajikistan under SCISPM Sending the Country Spreadsheet to Development Partners with entered data from AIMS Country Spreadsheet (preliminary version) Clarification and validation of AIMS data by partners Ministries and departments, PIUs Доноры Доноры Development Partners Consultative process AIMS Country Spreadsheet (Final Version) UNDP/OECD JST
Global Partnership Monitoring in Tajikistan • National ownership – SCISPM is National coordinator at the Global Partnership Monitoring in Tajikistan; • The Country Spreadsheet contains information on development co-operation for 22 countries-partners, including 14 bilateral agencies, European Union, 13 multilateral organizations, 9 UN agencies (information on them is presented in aggregated form); • 8 national ministries and agencies, 30 PIUs have been involved in the monitoring • Data on 448 foreign aid projects were covered. • National system of the monitoring of the development cooperation effectiveness – SCISPM AIMS was used. • Maintainedclosecommunicationandconsultationprocesswiththe UNDP/OECD JointSupportTeam;
Evaluation of the national level indicators of the Global Partnership Monitoring
Interlinked Cycles MED&T Planning Cycle NDS, PRS, PIP MoF Budget Cycle MTEF, Budget, SBS SCISPM Aid Cycle AIMS, FAR, DPP
Three interlocking circles NDS, PRS, PIP (planning cycle) Items financed by State Budget (budget cycle) Items financed by foreign aid (foreign aid cycle)
AIMS – PRS/PIP: Relationship Best Scenario Usual Scenario PRS/PIP PRS/PIP AIMS AIMS Unfunded or Pipeline Projects Projects not found in PIP Unfunded or Pipeline Projects
Project Stages Pipeline Projects Closed Projects Pipeline Projects PIP AIMS Audit Review Project Closed Review Mission Fact-finding Mission Project Mobilization Evaluation Mission Agreement Signed Disbursement #2 Terms of Reference Disbursement #1 Included in PIP Project Identified Funding Identified Milestones
Interface between stakeholders SCISPM MED&T MoF MoFA Line Ministries Development Partners
The Scheme for attracting foreign aid for LSIS needs SCISPM DCC WG to support private sector development LSIS AM analysis The list of projects on LSIS measures (PS) LPP LSIS (PS) LSIS Sector: Improving the investment climate, private sector and entrepreneurship development • Total number of measures - 21 • Measures with estimated need - 3 • Measures with need not estimated - 18 Development of project proposals Donors SCISPM Entrepreneurship Support Department LSIS AM analysis AIMS
Key Challenges • Improvement of the AIMS data entry quality and timeliness; • Tracking of implemented changes in AIMS; • Full coverage of the project cycle and better orientation towards country priorities (PRS/LSIS/PIP); • Automatisation of document workflow between Ministries and departments in the PIP framework.
Next steps Resources Results
Thank you for your attention! http://aims.gki.tj E-mail: acip@gki.tj