Download
1 / 53
560 likes | 742 Views
Monitoring of Groundwater and Surfacewater Interactions on the Walla Walla River. Graduate Student: Starr Silvis Major Professor: John Selker Field Coordinator: Bob Bower. Presentation Outline. Location and features of the basin Background Goals Methods Chemical Signature

E N D
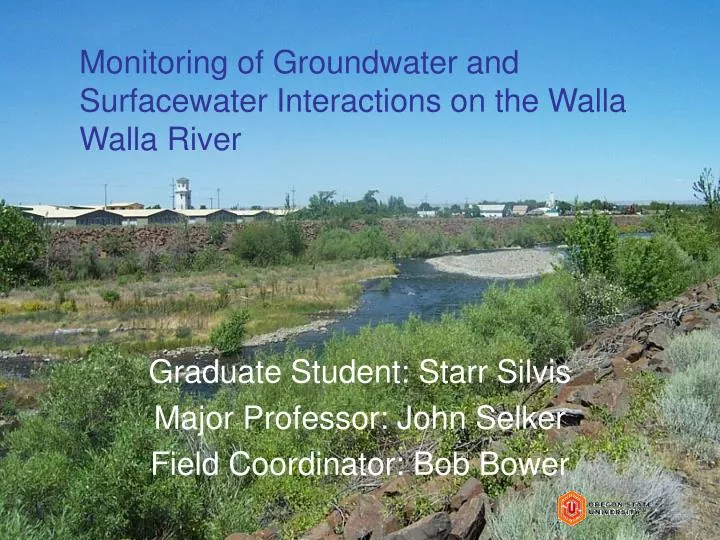
Monitoring of Groundwater and Surfacewater Interactions on the Walla Walla River Graduate Student: Starr Silvis Major Professor: John Selker Field Coordinator: Bob Bower
Presentation Outline • Location and features of the basin • Background • Goals • Methods • Chemical Signature • Mini-piezometers • Temperature Profiling • Results • Discussion
Water Resources for the Basin • Surface water • North Fork and South Fork • Groundwater • Alluvial aquifer • Basalt aquifers
Monthly Mean Flows 22 years of data 1969 - 1991
Walla Walla River Returns! • All river water above levied section (~100 c.f.s.) diverted for irrigation since turn of the century from June – September • 1998 American Rivers lists Walla Walla River as one of the top 20 most endangered rivers in the U.S. • Bull trout and Steelhead E.S.A. listed in 1998 and 1999 • Irrigation districts pledge to leave flow in the mainstem of the Walla Walla River; sign agreement with U.S.F.W. • 2000 – 13 c.f.s • 2001 – 18 c.f.s. • 2002 – 25 c.f.s • 2003 - ?
Summer 1999 Summer 2002
Low Flow Limitations • 2000 - all 13 c.f.s. percolated from the surface • Possible causes • In-stream gravel mining • Naturally high hydraulic conductivity (Schälchli, 1995,1992) • Large hydraulic gradients due to low aquifer levels
Aquifer Recharge • Irrigation ditch losses • Primarily unlined ditches • Stream losses • Winter recharge • Now – summer recharge too
Study Goals • Provide quantitative framework for the surface and groundwater exchanges • Determine influent / effluent nature of levied section • Quantify river losses • Identify seasonal patterns • Estimate alluvial aquifer recharge
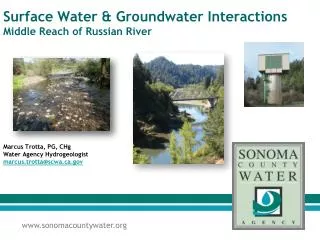
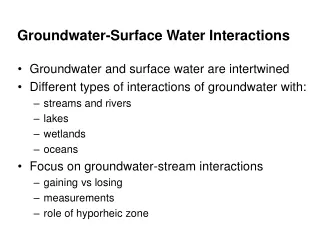
SW/GW Overview Water flows from the stream into the subsurface Water flows from the subsurface into the stream
Methods • Chemical Signature • Mini-piezometers • Temperature profiling • Ditch loss
Chemical Signature Requirements • Conservative and naturally occurring • Chloride and Sulphate • GW/SW must have distinctly different concentrations • Ease of analysis • Ion chromatography
Chemical Signature • Grab Sampling • Mainstem Walla Walla River • Shallow aquifer wells • 10% duplicate sampling • Data Analysis • Mixing space diagrams • Linear Regressions • Mass Balance
Qgw Cgw Qsin Qs Cs Csin Upstream sampling point Downstream sampling point Accumulation = In – Out Accumulation = 0 In = Out Chemical Signature; Mass Balance
Groundwater Sampling Sites Red dots are wells Hwy 11 Tumalum Bridge Walla Walla River Nursery Bridge Milton-Freewater
In-Stream Sampling Sites Tumalum Bridge Nursery Bridge Milton-Freewater
Mini-Piezometers Vertical Hydraulic Gradient = dh/dl Stream surface dh Streambed surface dl Mid-point of perforations
Temperature profiling device Mini-piezometer
Temperature Profiling Analytical Methods • HYDRUS-2D (Šimůnek et al., 1999) • Computer model using inverse processes to solve for vertical flux • Sine Wave Fitting • Stallman’s (1965) equation for a sine wave fit to the data
Temperature Profiling • HYDRUS-2D • Sophocleus (1979) Conduction Convection
Temperature Profiling • Sine Wave Fitting • Stallman (1965) • Solution for diurnally heated and cooled boundary condition Tz (t) = ΔT e-az sin (2πt/τ – bz) + Taz
Temperature Profiling; No Flux HYDRUS-2D no flux simulation R2 = 0.95
Ditch Loss Study Installed dam Covered with plastic Allowed to fill to capacity Shut off water supply Measured time and depth of draining for 6 hours
Chemical Signature; GW R2 = 0.89
Chemical Signature; SW R2 = 0.96
Chemical Signature; Mass Balance Filled symbols correspond to left axis, open symbols correspond to the right axis GW dominates Tumalum Bridge SW dominates Qgw Qsin
Mini-piezometers Nursery Bridge Tumalum Bridge duplicates duplicates
Temperature Profiling; Sine Wave M 5.5 August 14
Temperature Profiling; Sine Wave vs. HYDRUS-2D Pink are results using loggers 3 to 2 (15 cm) Blue are results using loggers 3 to 1 (30 cm)
Seasonal Patterns; Mini-Piezometers K = -Q / (A dh/dl)
Ditch Loss • Infiltration estimate 204 cm/d
Conclusions • Effluent river on section studied • Estimated flow loss • 0.3-0.76 m3/s using temperature estimates • 0.43-0.63 m3/s using in-stream flow measurements • Seasonally hydraulic conductivity decreased • factor of 2-4 using temperature profiling estimates • factor of 2-100 using mini-piezometer estimates
Implications for GW recharge of the shallow aquifer • Assuming only 50 km of ditches with an average infiltration rate of 204 cm/d • 2 * 107 m3 / yr • On an area of 538 km2 and a porosity of 0.27equivalent to 23 cm of water • Assuming 5 months at max infiltration rate of 310 cm/day using temperature profiling estimates • 1.8 * 108 m3 / yr • On an area of 538 km2 equivalent to 1.2 meters of water