1 / 5

Topic 5.3: Populations

Topic 5.3: Populations . 5.3.1: Outline how population size is affected by natality , immigration, mortality and emigration . . 5.3.2: Draw and label a graph showing a sigmoid (S-shaped) population growth curve.

sasha
Download Presentation

Topic 5.3: Populations

An Image/Link below is provided (as is) to download presentation Download Policy: Content on the Website is provided to you AS IS for your information and personal use and may not be sold / licensed / shared on other websites without getting consent from its author. Content is provided to you AS IS for your information and personal use only. Download presentation by click this link. While downloading, if for some reason you are not able to download a presentation, the publisher may have deleted the file from their server. During download, if you can't get a presentation, the file might be deleted by the publisher.

E N D

Presentation Transcript


  1. Topic 5.3: Populations

  2. 5.3.1: Outline how population size is affected by natality, immigration, mortality and emigration.

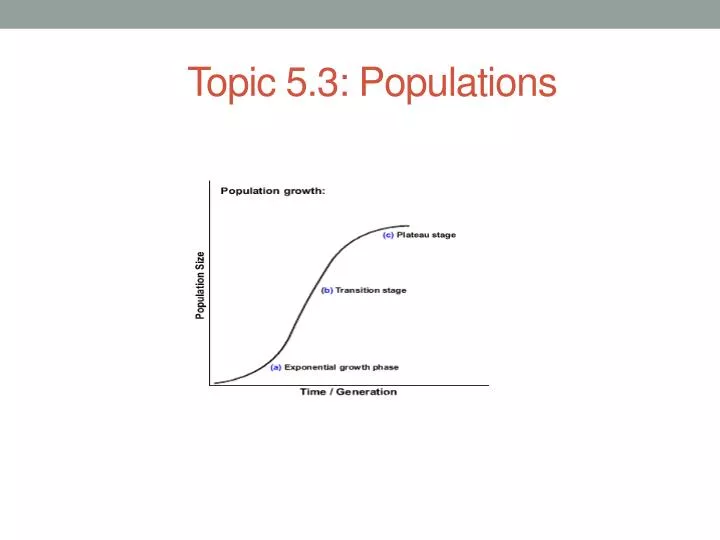
  3. 5.3.2: Draw and label a graph showing a sigmoid (S-shaped) population growth curve. 5.3.3: Explain the reasons for the exponential growth phase, the plateau phase and the transitional phase between these two phases.

  4. 5.3.4: List three factors that set limits to population increase.

More Related