Download
1 / 66
660 likes | 741 Views
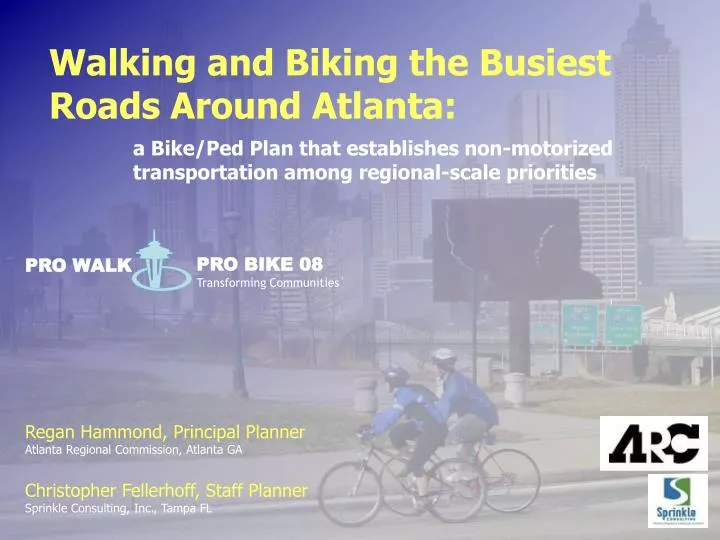
Walking and Biking the Busiest Roads Around Atlanta:. a Bike/Ped Plan that establishes non-motorized transportation among regional-scale priorities. PRO BIKE 08 Transforming Communities`. PRO WALK. Regan Hammond, Principal Planner Atlanta Regional Commission, Atlanta GA.

E N D
Walking and Biking the Busiest Roads Around Atlanta: a Bike/Ped Plan that establishes non-motorized transportation among regional-scale priorities PRO BIKE 08 Transforming Communities` PRO WALK Regan Hammond, Principal PlannerAtlanta Regional Commission, Atlanta GA Christopher Fellerhoff, Staff PlannerSprinkle Consulting, Inc., Tampa FL
Bike/Ped Planning in Metro Atlanta • The Bicycle: A Plan and Program for its Use as a Mode of Transportation and Recreation (1973). • ISTEA (1991) • Bicycle and Pedestrian Taskforce (1992) • Atlanta Region Bicycle Transportation and Pedestrian Walkways Plan(1993). • Updates: 1995, 2002.
Bike/PedPlanning in Metro Atlanta • All provided policy direction and included project lists • Lacked a strategic vision for the prioritization of federal funds for bike/ped in the Atlanta region. • Projects recommended did not come together to form a complete network.
Bike/PedPlanning in Metro Atlanta • New Plan developed in 2006-2007 • Established a strategic focus to integrate non-motorized planning with regionally significant transportation issues • Developed a prioritization processfor bike/ped funding assistance
Regionally Significant Issuesin Metro Atlanta • Congestion Mitigation • Air Quality • Environmental Justice • Mobility • Accessibility • Safety • Healthy Living • “Livability” Initiatives
Plan Goals and Objectives • Written to address regionally significant issues, strengthening the link between bike/ped and existing regional priorities
Priority Corridors and Centers • Roadways of the Regionally Strategic Transportation System
Priority Corridors and Centers • Regionally Significant Nodes • LCI study sites • Cities with population greater than 5,000 • County Seats • Major transit facilities • Major “activity centers”
Priority Corridors and Centers • Plan recognizes that full bicycle network includes all streets
How to Measure Performance:Conditions that Affect Cyclists • Effective Travel Width for Bicyclists • On-Street Parking Encroachments • Volume of Motor Vehicles • Speed of Traffic • Proportion of Heavy Vehicles • Pavement Surface Condition
Photo by Sprinkle Consulting, Inc. Photo by Sprinkle Consulting, Inc.
Performance Measure:Bicycle Level of Service Model Bicycle LOS = a1ln(Vol15/L) + a2SPt(1+10.38HV)2 + a3(1/PC5)2 - a4(We)2 + C Vol15 = volume of directional traffic in 15-minute time period L = total number of through lanes SPt = effective speed limit (see below) SPt = 1.12ln(SPP -20) + 0.81 SPP = Posted speed limit HV = percentage of heavy vehicles PC5 = FHWA’s five point surface condition rating We = Average effective width of outside through lane
Existing Conditions (2006) • Bicycle Level of Service • Study network of 690 miles in 18 counties • Results for 642 miles • Distance Weighted Average of 4.54 = Bicycle LOS “E”
Existing Conditions (2006) • Bicycle Level of Service = “E”
Existing Conditions (2006) • Bicycle Level of Service = “E”
Existing Conditions (2006) • Bicycle Level of Service = “E”
Latent Demand Method • Predicts probability ofnon-motorized tripsbased on proximity ofgenerators and attractors...if impedance were removed
Latent Demand Method • Used 2001 NHTS trip lengths for walking and biking for: • Work Trips ( also used for higher ed.) • Shopping • School Trips • Social Recreational Trips • Trips to Access Transit
Existing Conditions (2006) • Pedestrian Conditions • Sample analysis of longitudinal conditions at high demand nodes with Pedestrian Level of Service Model • Discussion of challenges of crossings, both at intersections and mid-block locations
Pedestrian Policy Review • PEDS Survey 2006- 6 of 13 counties had standard sidewalk requirements in place • Remaining counties had variable requirements • Staff vigilance drives action, rather than policy
Bike Policy Review • On street facilities may be included overlay districts or other special cases • Staff vigilance drives action rather than policy
Existing Conditions (2006) • Bicycle conditions are very challenging • Walking conditions are very challenging • Policies are inconsistent across the region
Needs Assessment • What level of accommodation is appropriate on this class of roadway?
Needs Assessment • Community workshops to “find the level” • Bike/Ped Levels of Service “C” chosen as a general target; • Bike Ped LOS “B” for high activity areas
Needs Assessment • Recommended strategies for improvement • LOS met • Re-striping • Widen shoulder • Detailed Corridor Study
Needs Assessment • Consideration of Alternative Routes
Needs Assessment • Consideration of Alternative Routes
Needs Assessment • Strategically evaluating projects’ contributions to regional goals requires prioritization based on those goals
Needs Assessment • Prioritization Process • Prioritization Process • Magnitude of need
Needs Assessment • Prioritization Process • Prioritization Process • Latent Demand
Needs Assessment • Prioritization Process • Prioritization Process • Congestion Measure
Needs Assessment • Prioritization Process • Prioritization Process • “Votes” from Workshops